Based on I have created an initial equilibrium for the PB studies. In addition to the information in the Minwoo’s post, I have also used some information from our e-mail correspondence. In particular, I have set the line average density as and the central electron temperature as 1.3 keV. I have also made the following assumptions:
The pedestal width is the same for the temperature and density profiles. It is equal to 0.06 of the normalized poloidal flux;
The pedestal temperature is 400 eV;
The pedestal density is ;
The ion temperature is equal to the electron temperature;
I assumed that the central q is slightly above unity.
I have also used relatively standard geometry parameters for KSTAR such as the major radius is 1.77 m, the minor radius is 0.47 m, elongation is 1.9, and triangularity is 0.8.
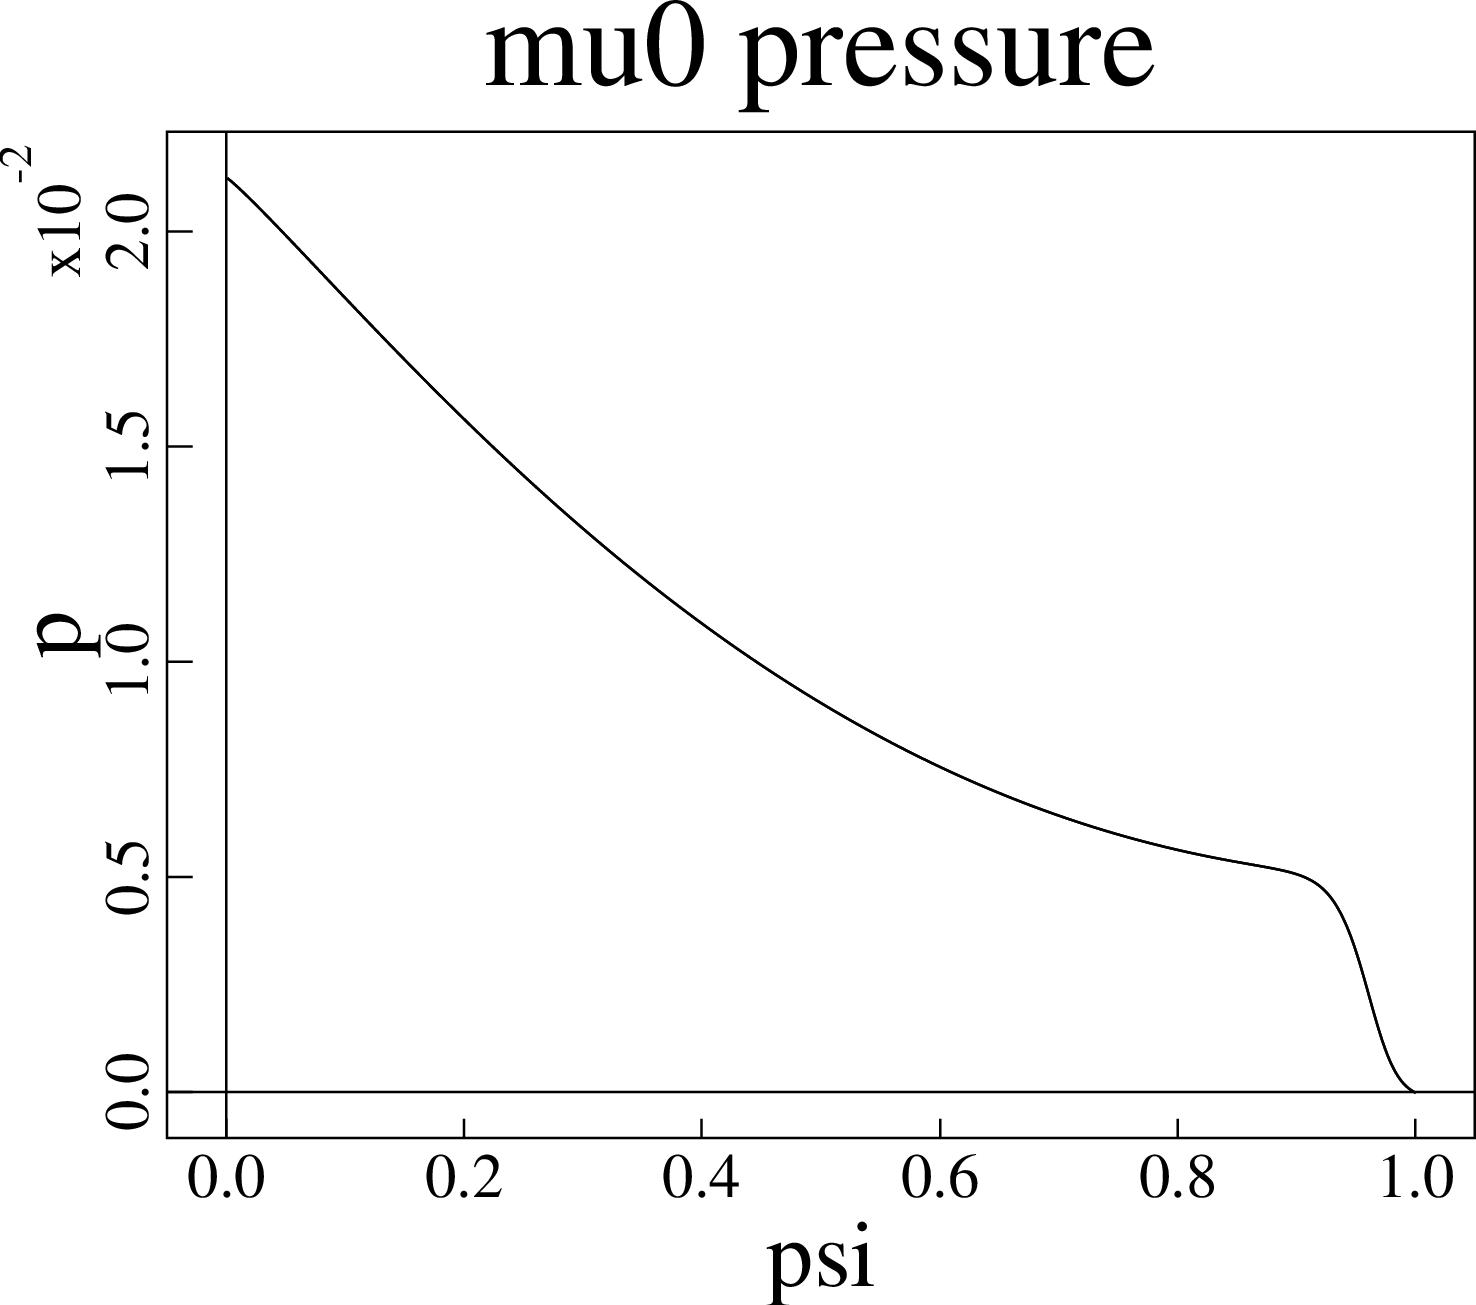
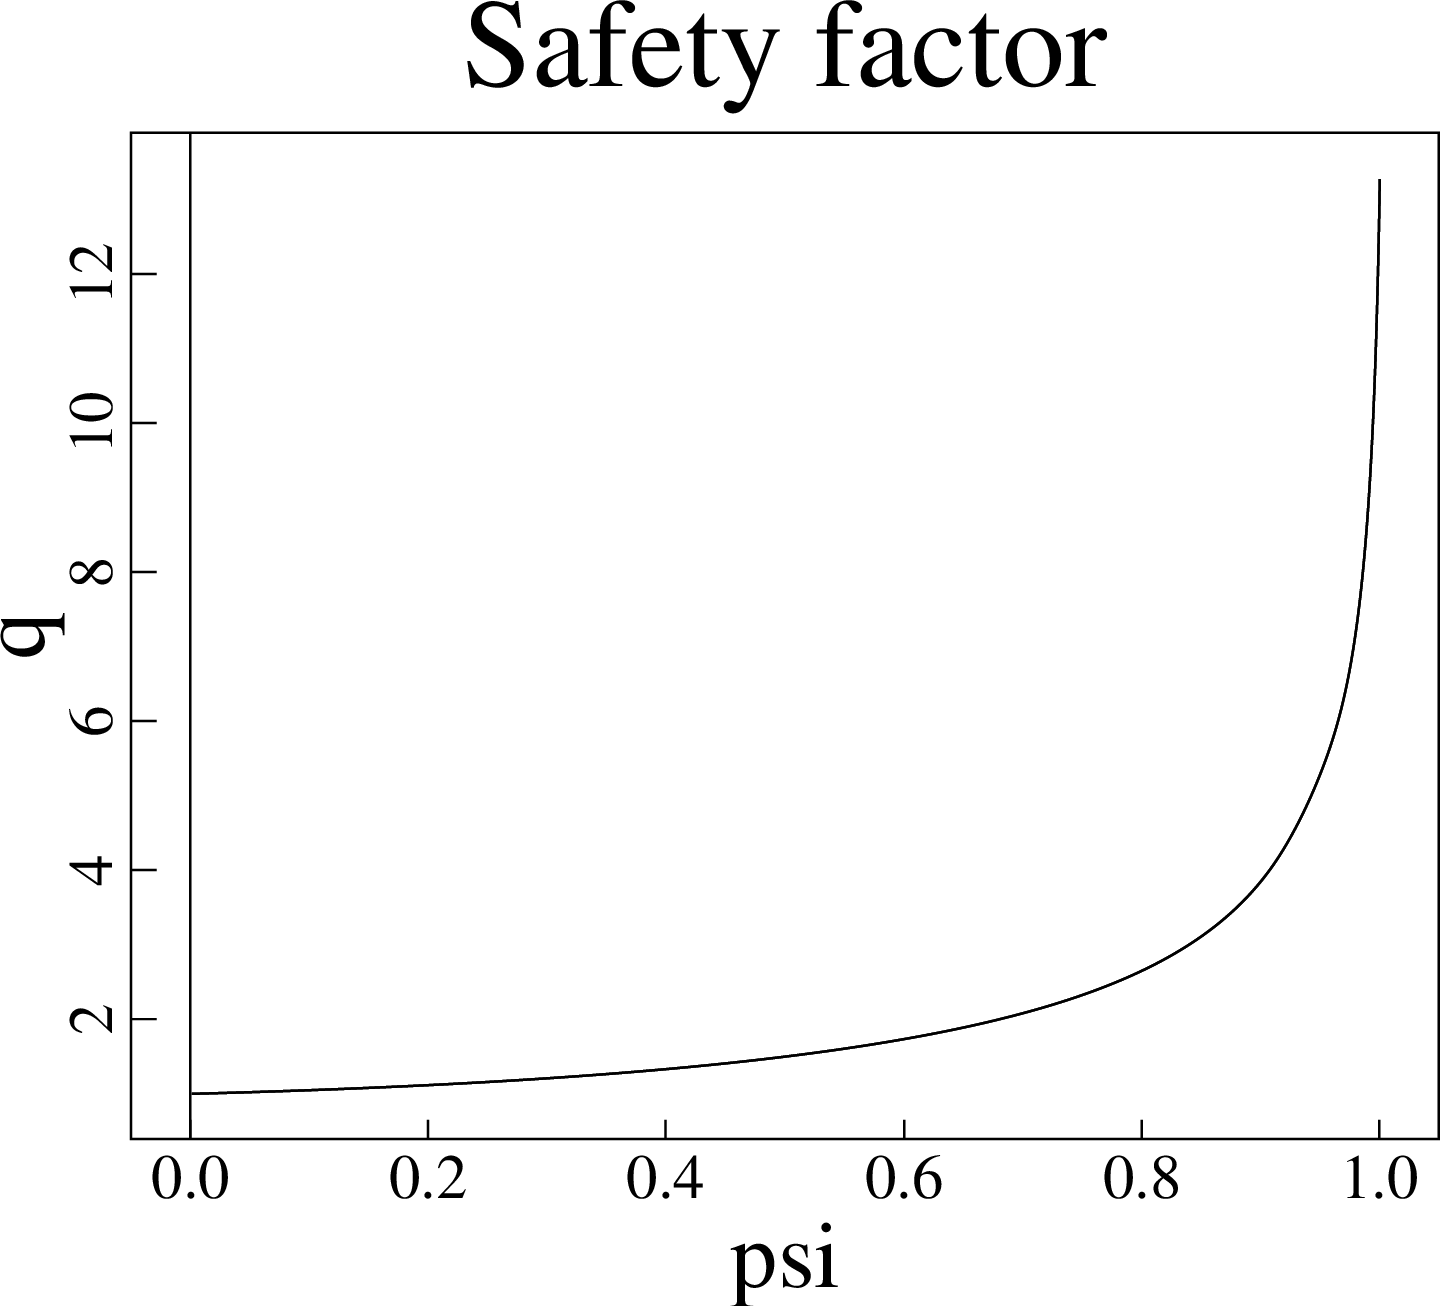
The q95 value that I am getting using the above settings is 5.06. The plasma pressure and q profiles are shown below.
Minwoo indicated that they observed the ELM mode structures around 222~223 (cm) in major radius. In the equilibrium that I have generated the H-mode pedestal extends from R=221.8 cm to 224 cm. The location of maximum pressure gradient in my equilibrium is at R=223 cm.I think these settings are consistent with your experimental observations.
Target KSTAR discharge is #7328 since we have clear ECEI observation data and toroidal mode analysis data from toroidal Mirnov coil array and toroidally separated two ECEI system.
At the current flat top, plasma current, Ip, is 750 (kA), toroidal magnetic field, BT, is 2.25 (T), safety factor at 95% poloidal flux, q95, is ~ 5 and the plasma is heated by ~3 (MW) neutral beam only.
At first, bootstrap current is calculated using Sauter’s formula.
I have used the TEQ code in CALTRANS to generate a new equilibrium for the case T85Y that I have simulated using the XGC0 code last week. The plasma pressure and the bootstrap current profiles in the pedestal region are updated and a new equilibrium is generated. In order to ensure that the plasma profiles are monotonic, I have introduced a transition region where the profiles are modified. The plasma pressure in the transition region is computed using the following expression:
where is the plasma pressure in the original equilibrium files that is updated with the plasma pressure , $dp$ is the gap between the equilibrium pressure and the plasma pressure found by the XGC0 code at . This formula is applied for from 0 to 0.83. The characteristic width of the transition region is set to 0.2. The bootstrap current profile is updated in the same way.
The plasma profiles after update for the cases T85Y and T87Y looks like:
Plasma profiles in the original equilibrium and updated plasma profiles for the case T85Y
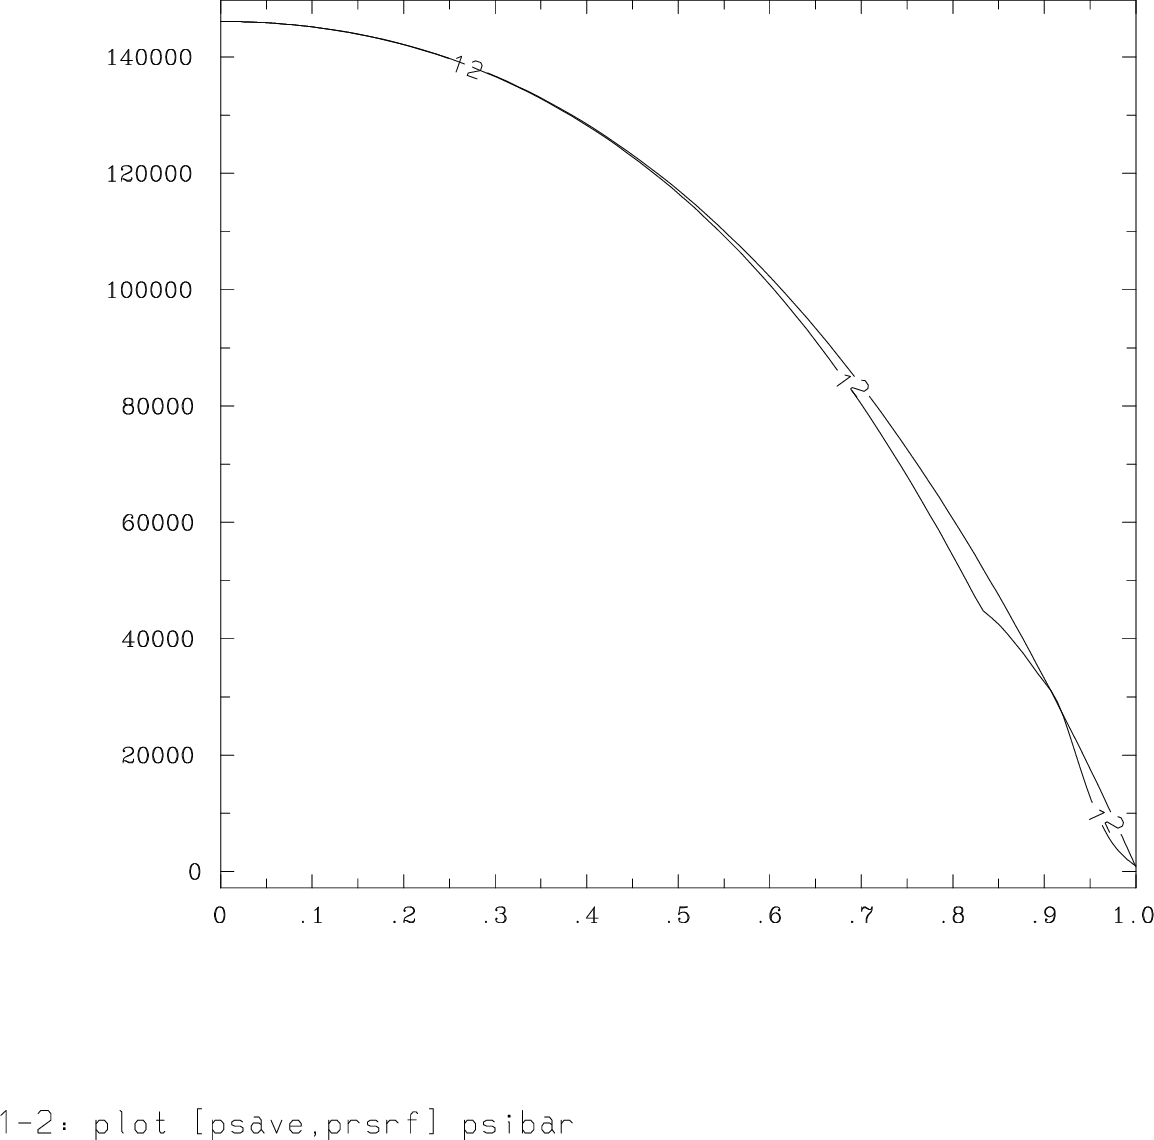
Plasma profiles in the original equilibrium and updated plasma profiles for the case T87Y
There is still change in the plasma pressure gradient in the transition region for the case T87Y. The transition width might need to be increased.
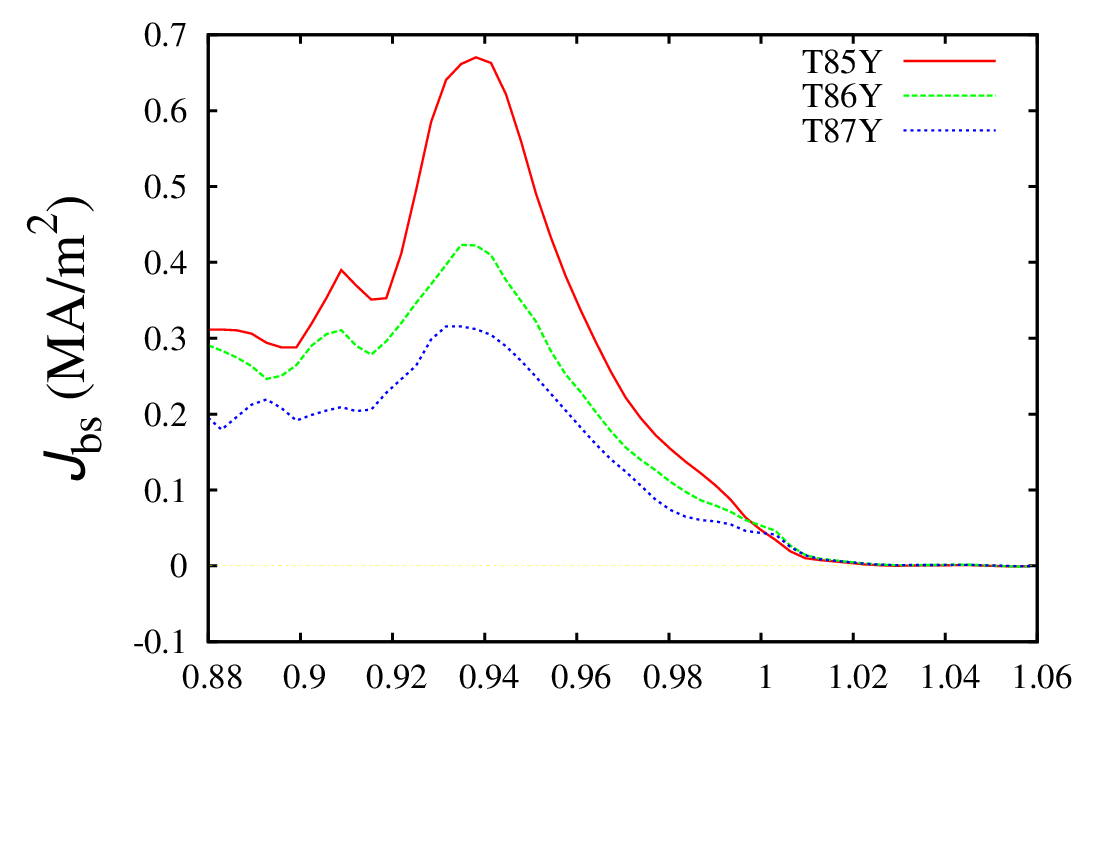
I have compared the bootstrap currents for the first three cases. Due to additional particle sources in the last case, I have excluded this case from comparison.
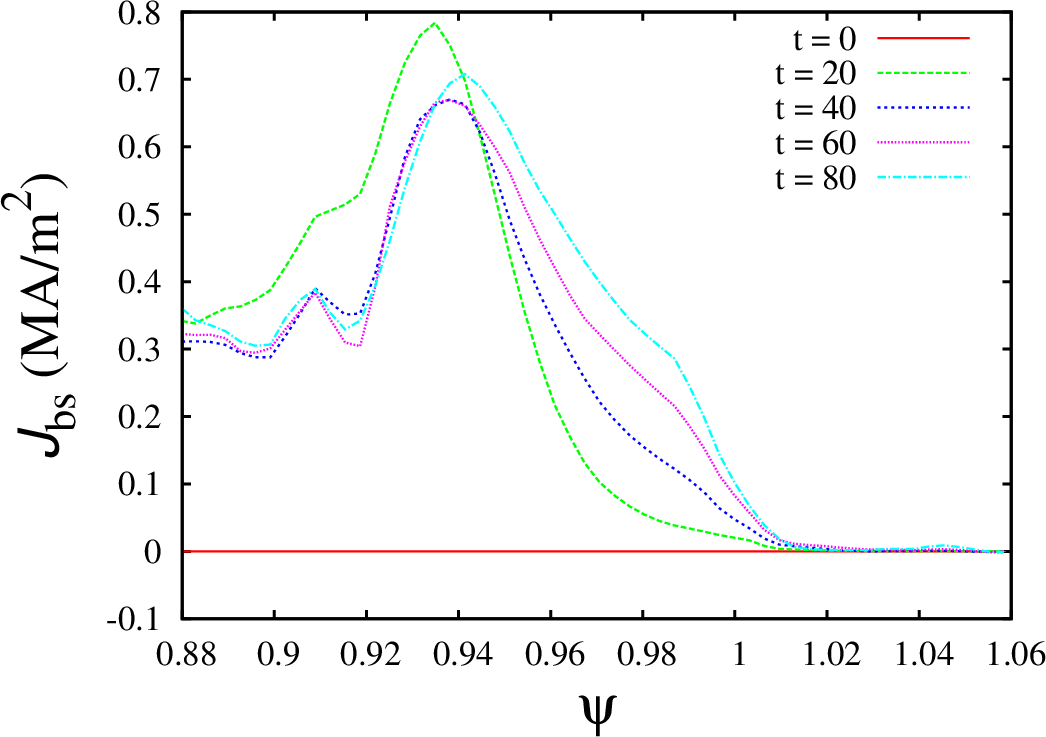
Case XGC-T85Y
Bootstrap current for the case XGC-T85Y
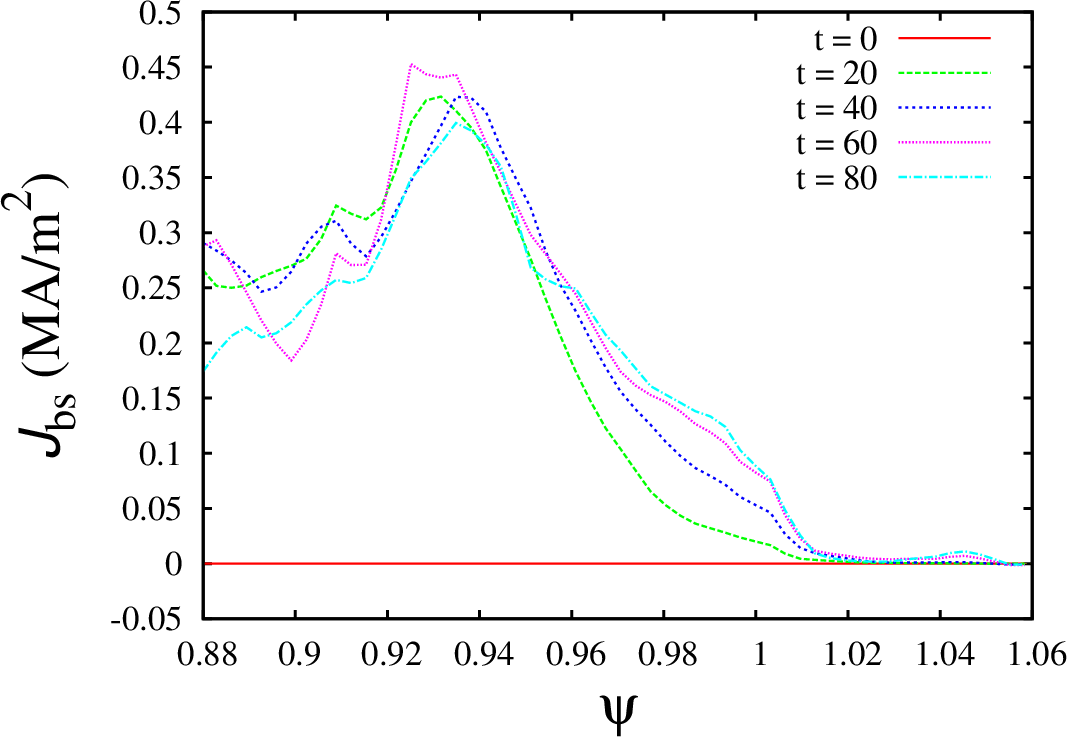
Case XGC-T86Y
Bootstrap current for the case XGC-T86Y
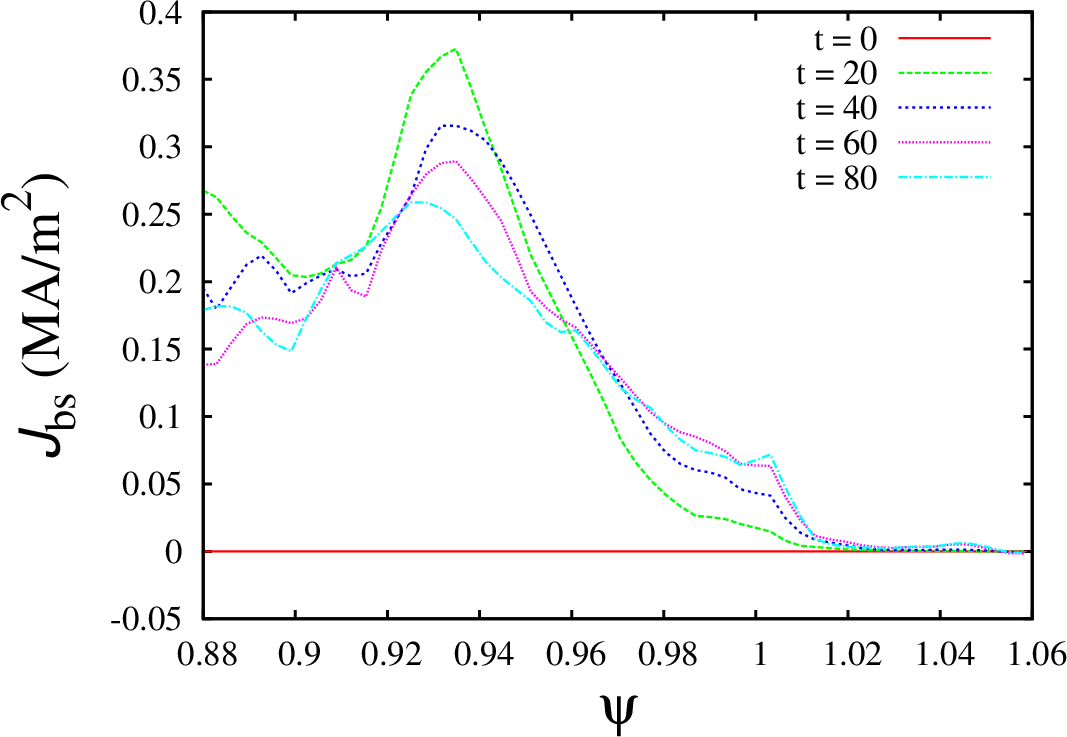
Case XGC-T87Y
Bootstrap current for the case XGC-T87Y
Comparison of bootstrap current after 40 ion transit times
Four cases has been created based on the equilibrium for the KSTAR discharge 06123. The original KSTAR equilibrium does not have the H-mode pedestal. The H-mode pedestal structure was selected to have the pedestal width approximately 0.08 of the normalized poloidal flux so that the pedestal top was located at . These assumptions are used only for the initial profiles. The XGC0 code computes the pedestal structure using the initial plasma profiles as initial conditions. Four cases that I have studied differ by the plasma collisionality. The plasma density and temperatures in each case has been modified so that the ratio for the initial profiles would change, but the plasma pressure remains constant. Differences in initial plasma profiles are summarized in the table below.
Case #
ptl_charge
Collisionality factor
XGC-T85Y
1.54
1.43
1
1
XGC-T86Y
3.14
0.7
1
8.5
XGC-T87Y
4.00
0.55
1
17.56
XGC-T88Y
4.92
0.447
2
65.39
For all four cases, I used the following assumption for the anomalous transport:
! particle transport tbl_D_coeff_in=0.7D0 ! m^2/sec, inside (pedestal top) value of D_turb tbl_D_coeff=0.04D0 ! m^2/sec, outside (pedestal bottom) value of D_turb tbl_D_coeff2=1.3D0 ! m^2/sec, D_turb for outside of separatrix (SOL+private flux region) ! ion thermal diffusivities tbl_therDi_coeff_in=0.8D0 ! m^2/sec, inside (pedestal top) value of thermal D_turb for ions tbl_therDi_coeff=1D-8 ! m^2/sec, outside (pedestal bottom) value of thermal D_turb for ions tbl_therDi_coeff2=4D0 ! m^2/sec, thermal D_turb for outside of separatrix (SOL+private flux region) for ions ! electron thermal diffusivities tbl_therDe_coeff_in=1.2D0 ! m^2/sec, inside (pedestal top) value of thermal D_turb for electrons tbl_therDe_coeff=1D-8 ! m^2/sec, outside (pedestal bottom) value of thermal D_turb for electrons tbl_therDe_coeff2=4D0 ! m^2/sec, thermal D_turb for outside of separatrix (SOL+private flux region) for electrons
The electron and ion temperature profiles and electron density profiles for all four cases are given below.
Case XGC-T85Y
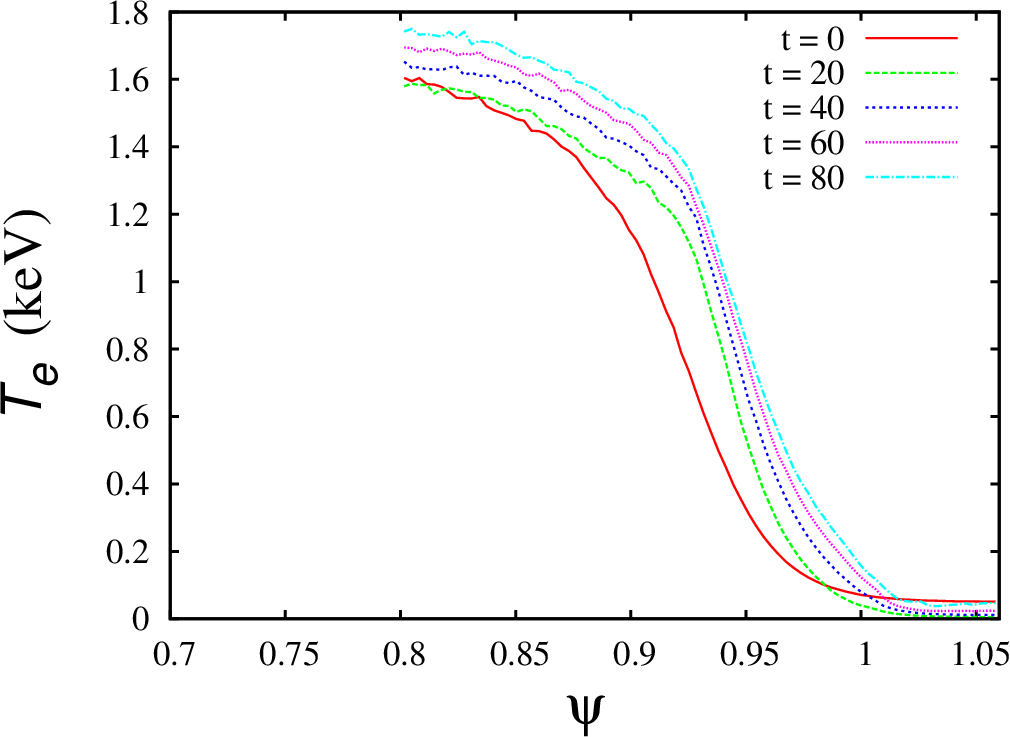
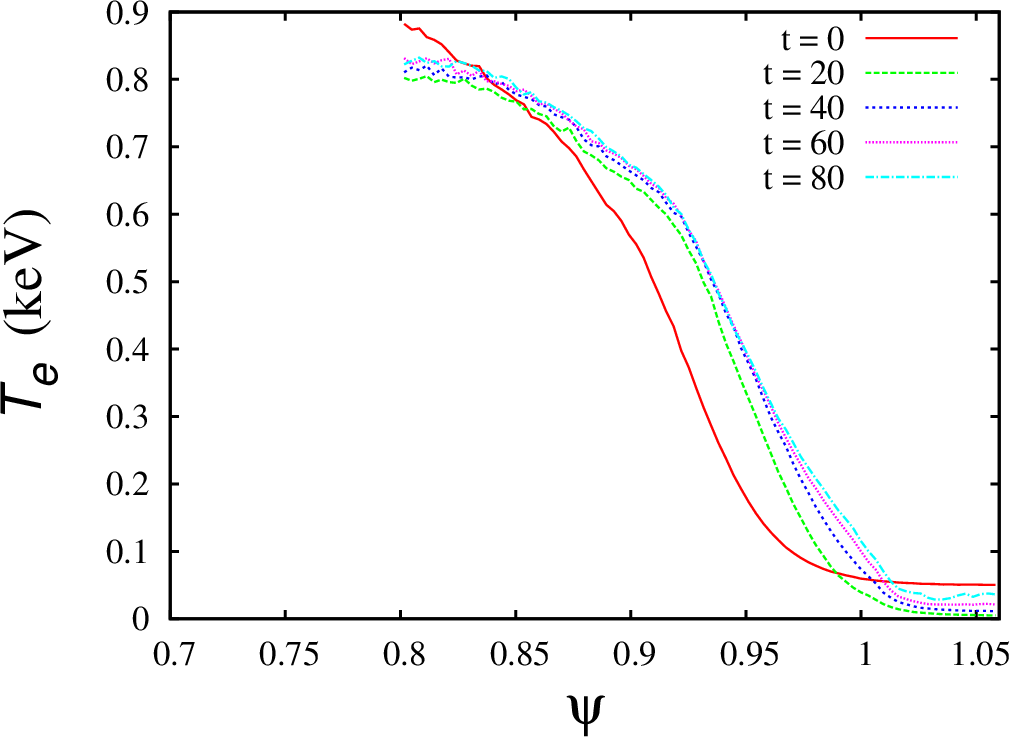
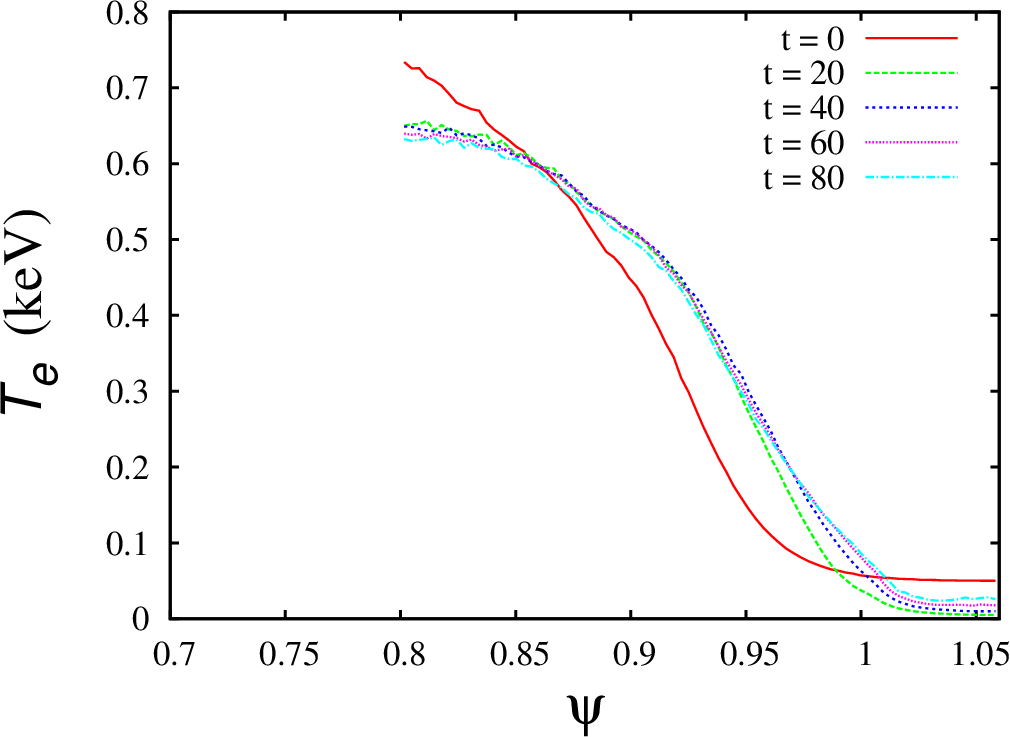
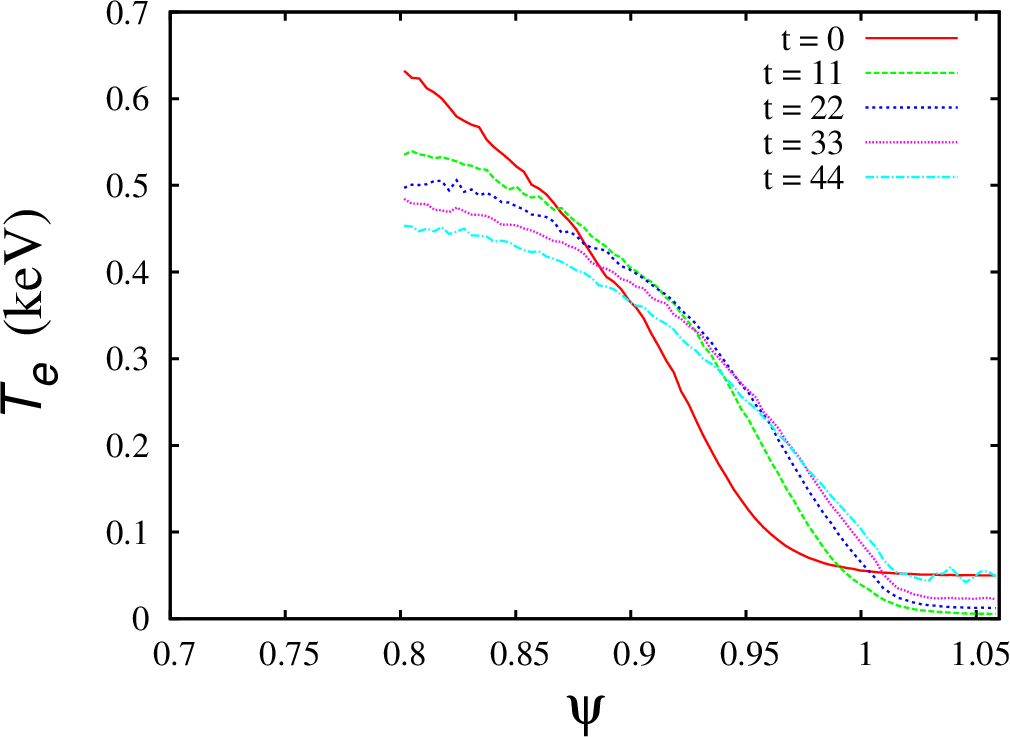
Electron temperature profile for the case XGC-T85Y
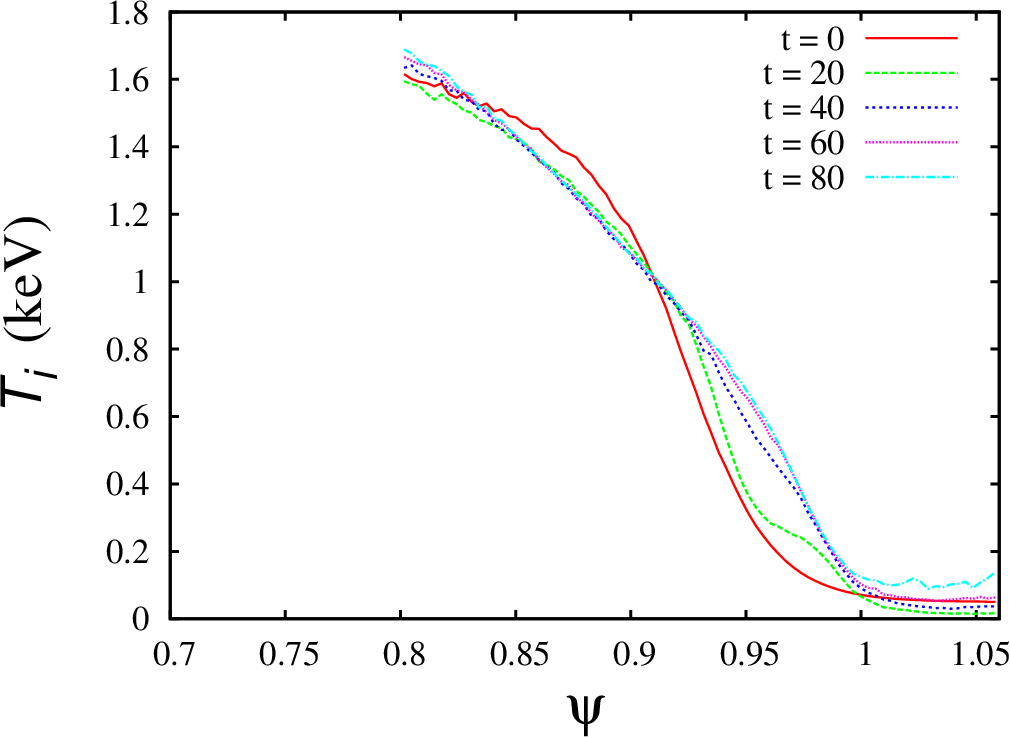
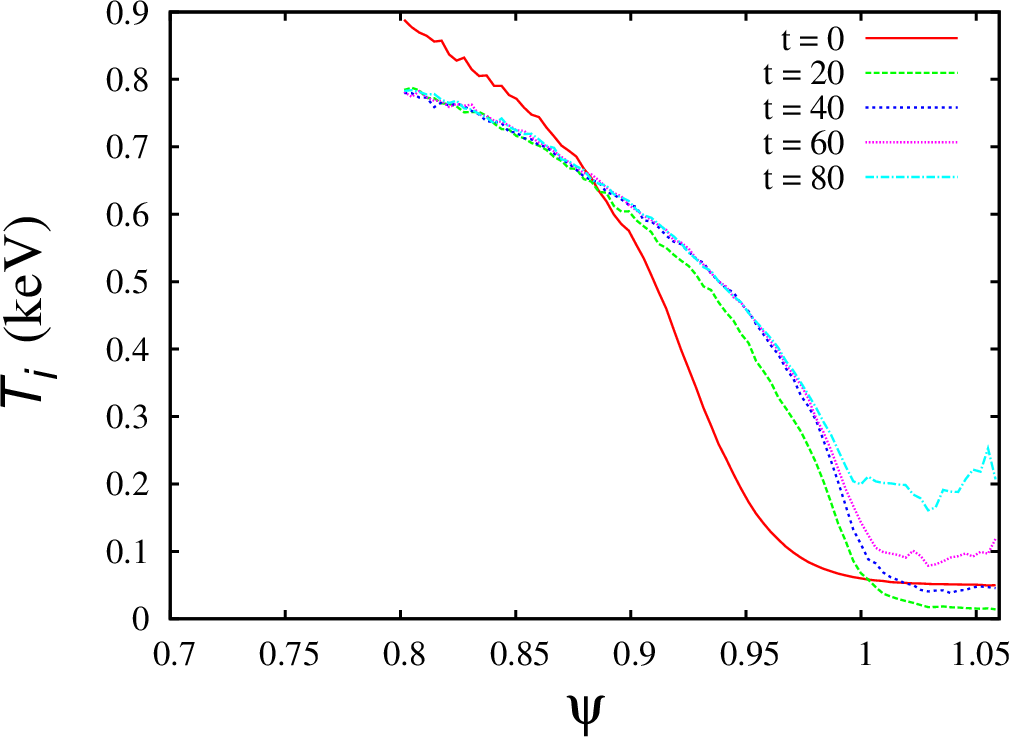
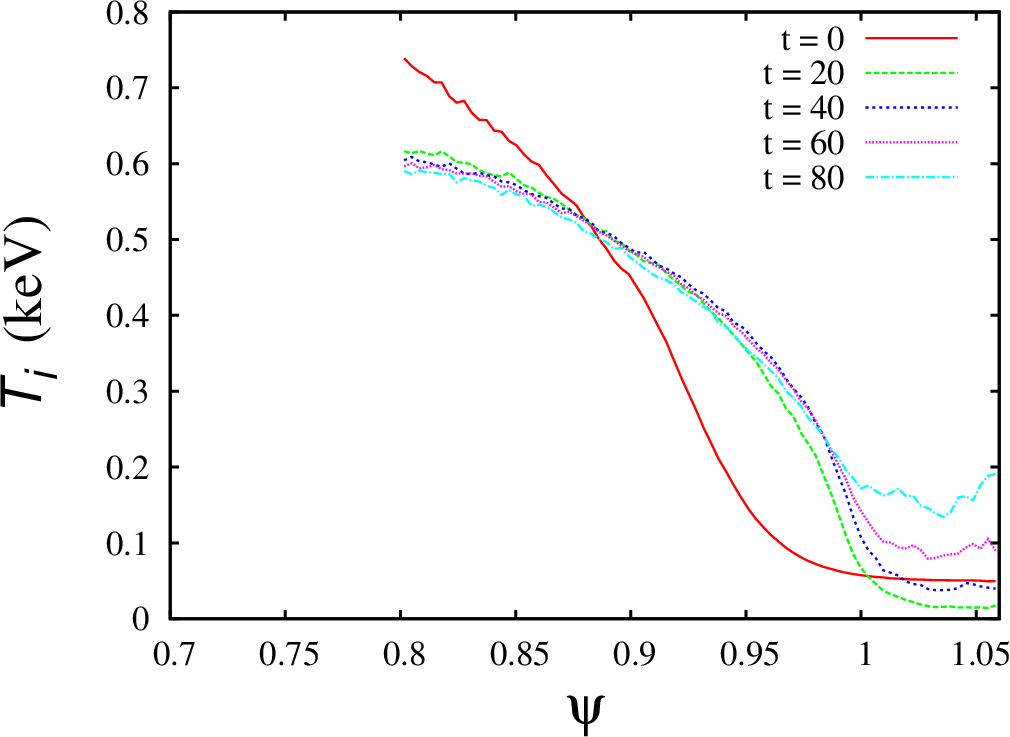
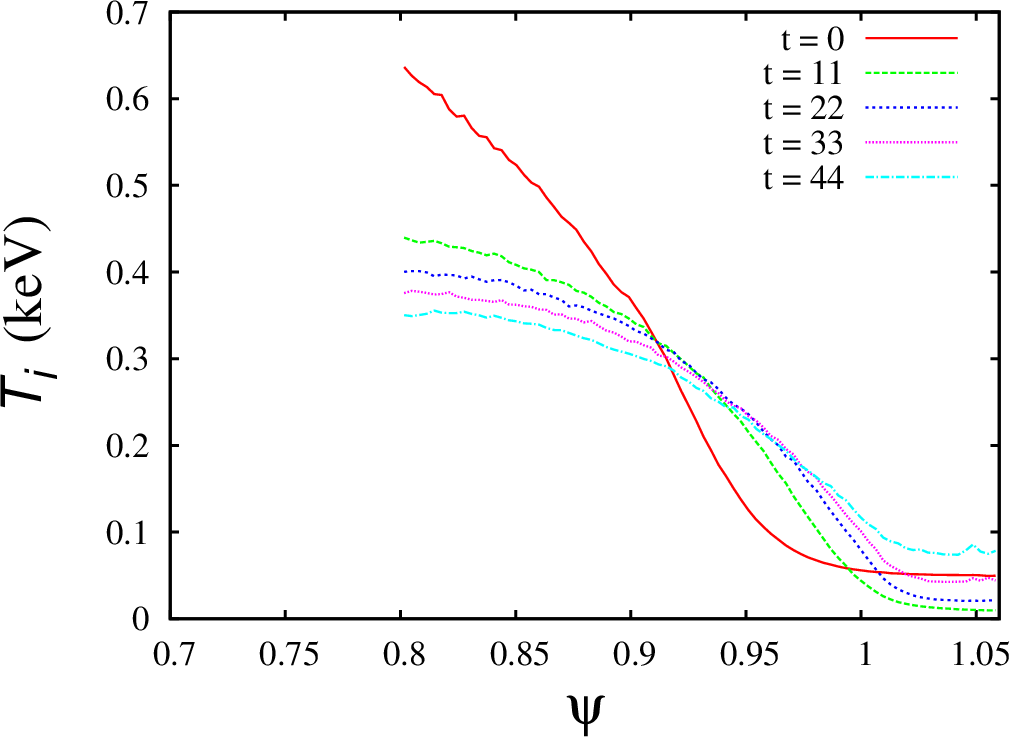
Ion temperature profile for the case XGC-T85Y
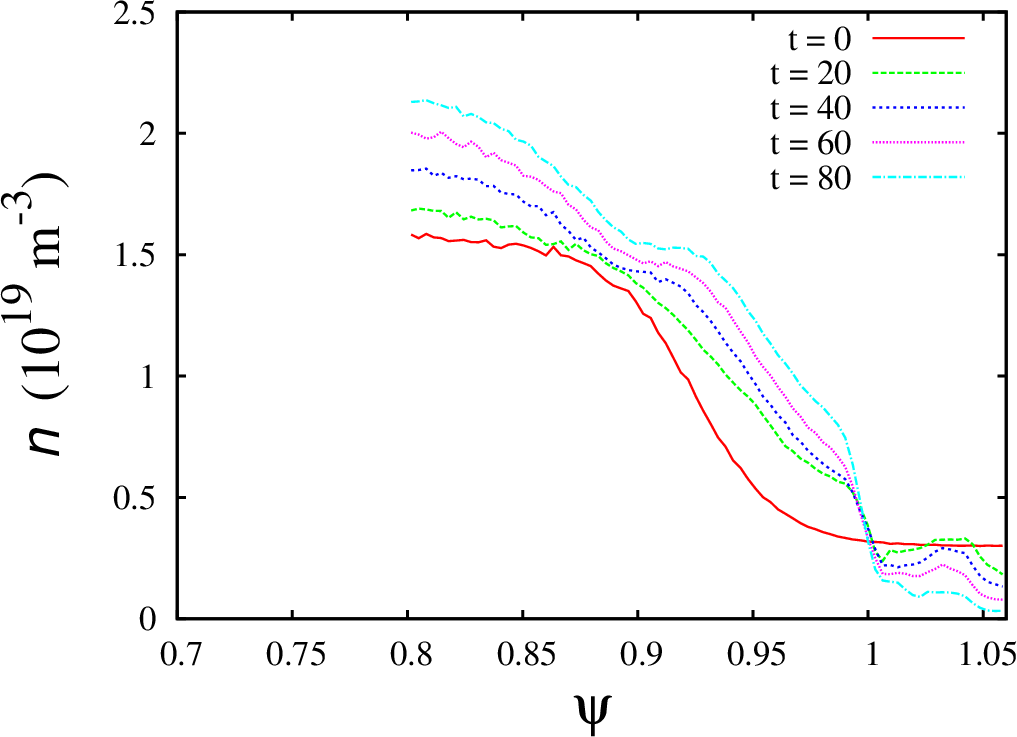
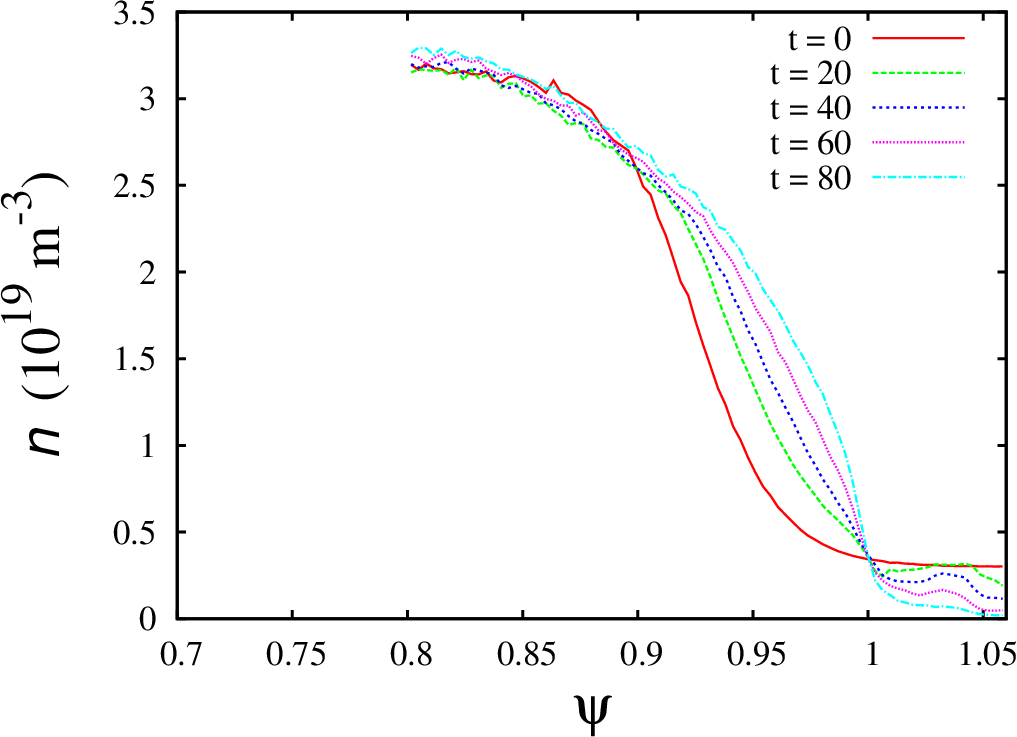
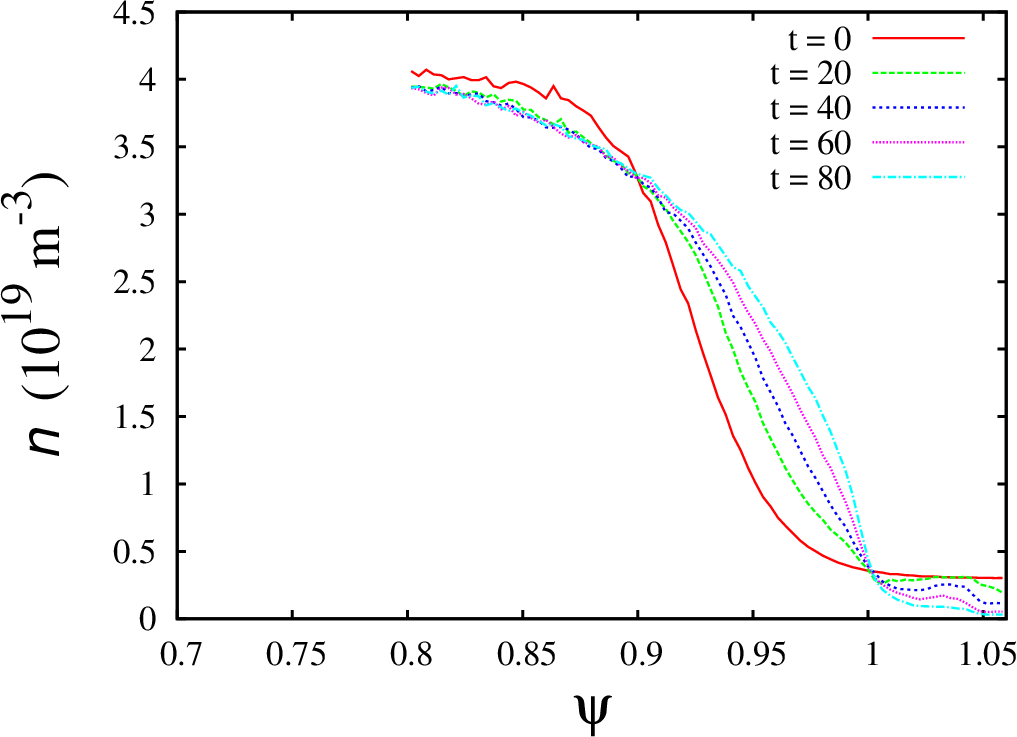
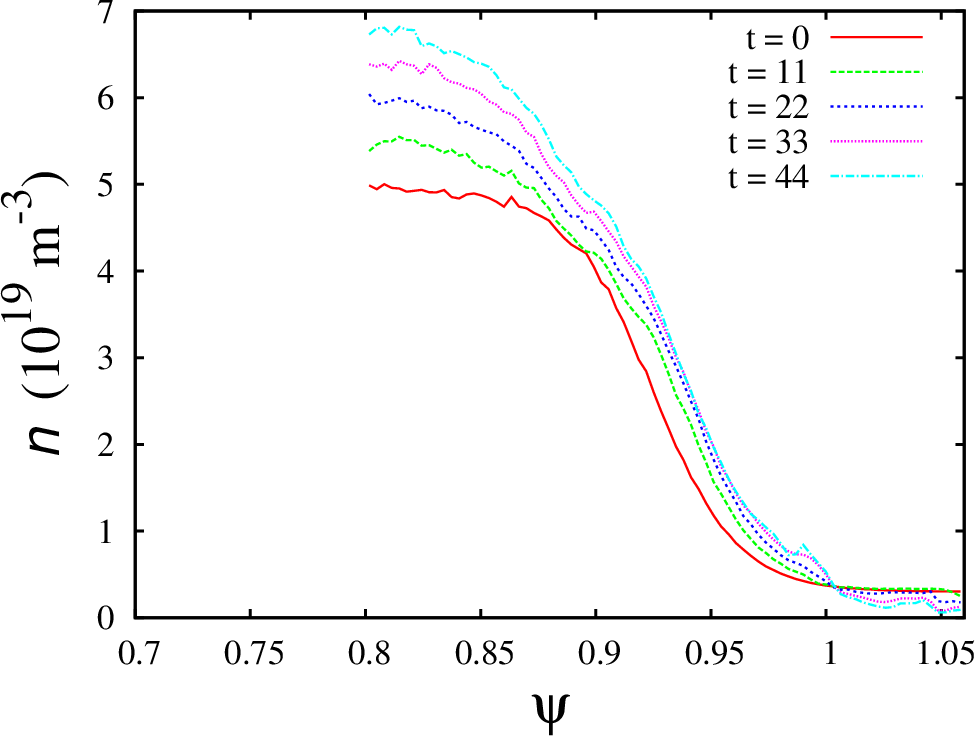
Electron density profile for the case XGC-T85Y
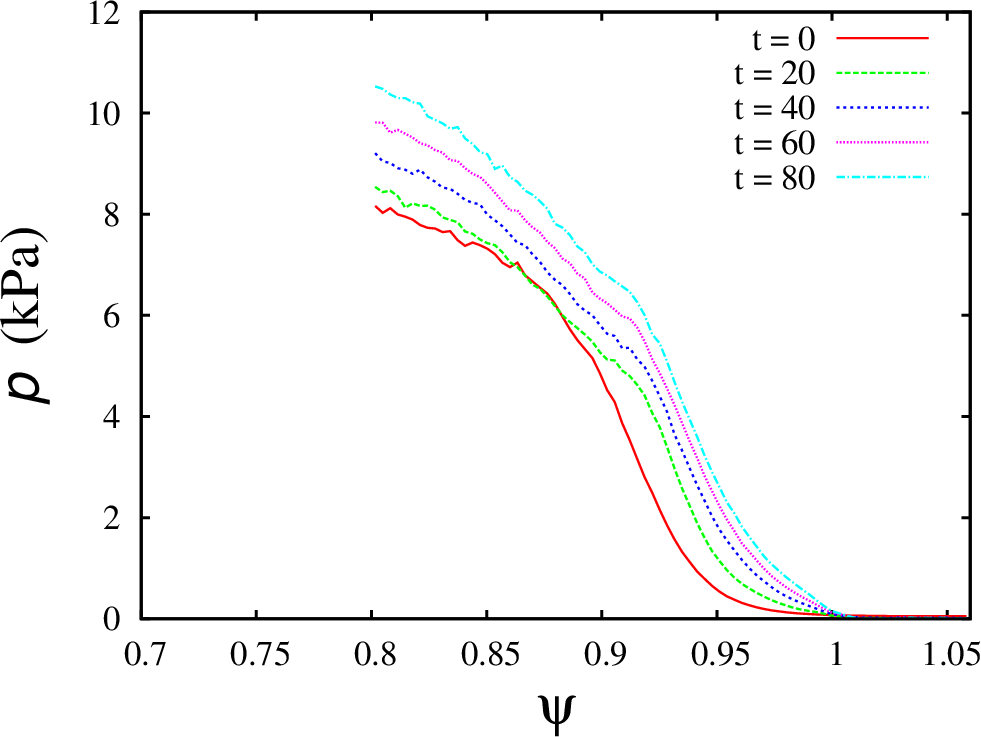
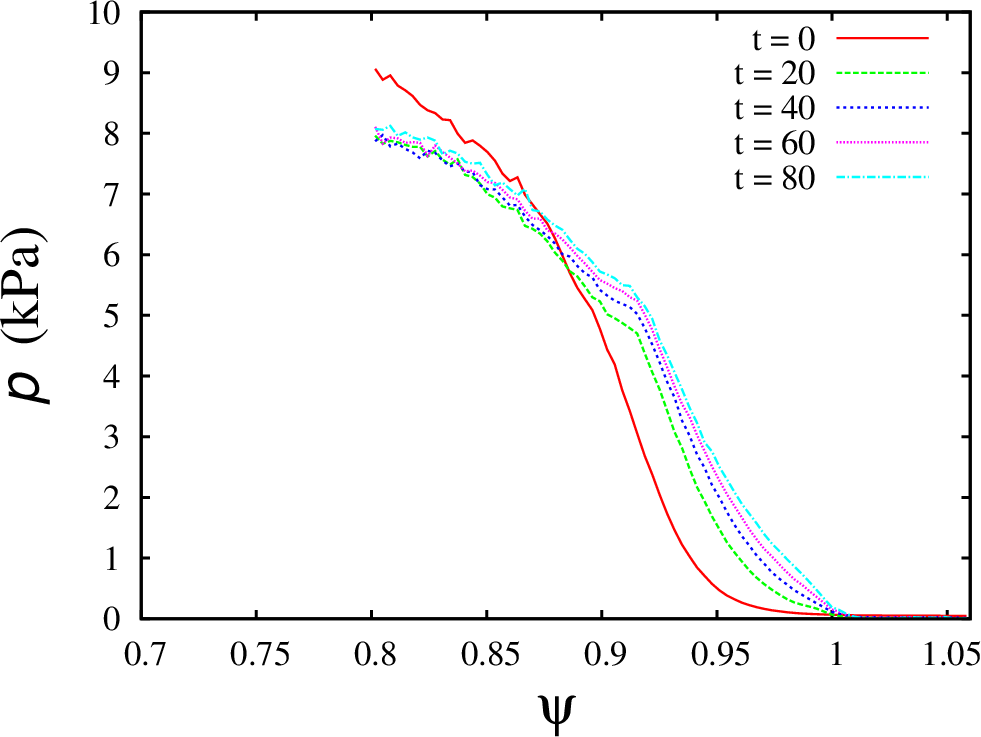
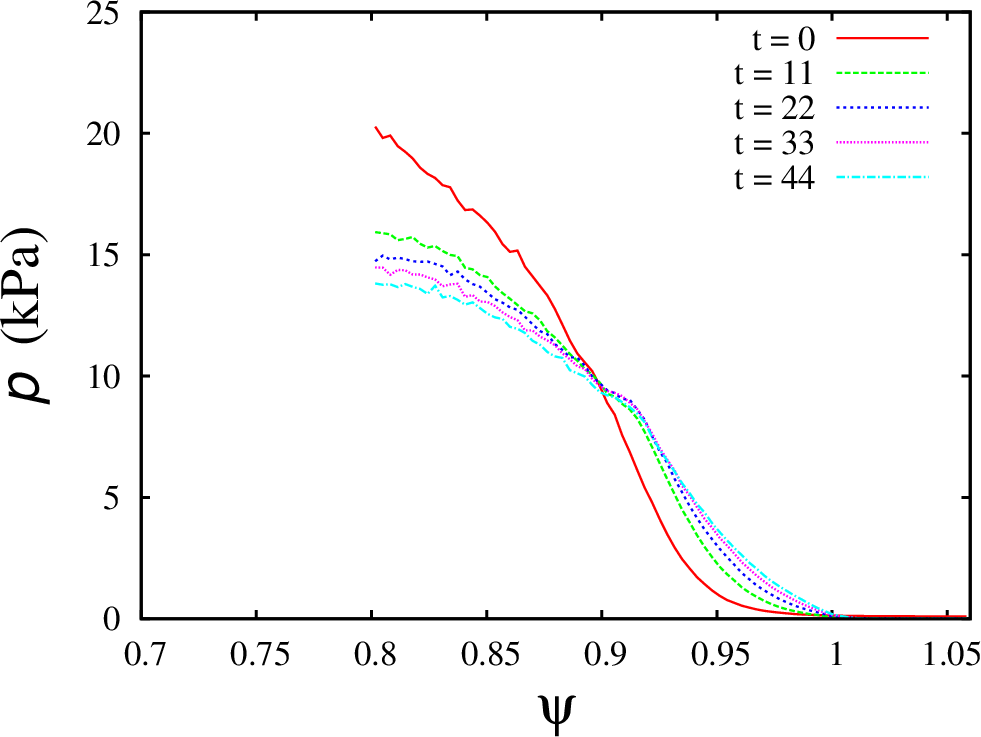
Plasma pressure profile for the case XGC-T85Y
Case XGC-T86Y
Electron temperature profile for the case XGC-T86Y
Ion temperature profile for the case XGC-T86Y
Electron density profile for the case XGC-T86Y
Plasma pressure profile for the case XGC-T86Y
Case XGC-T87Y
Electron temperature profile for the case XGC-T87Y
Ion temperature profile for the case XGC-T87Y
Electron density profile for the case XGC-T87Y
Plasma pressure profile for the case XGC-T87Y
Case XGC-T88Y
Electron temperature profile for the case XGC-T88Y
Ion temperature profile for the case XGC-T88Y
Electron density profile for the case XGC-T88Y
Plasma pressure profile for the case XGC-T88Y
Some observations:
The pedestal width is smaller than the width that is used for the initial profiles. The computed pedestal width is around 0.6-0.7 of the normalized poloidal flux for all cases.
During the XGC0 runs (44-80 ion transit times), the pedestal continue to grow only for the first two cases. The pedestal height decreases for two other cases. This effect is most notable for the last case, that has the largest collisionality. I had to increase internal particle source in this case in order to run it to 44 ion transit times. Event with increased particle sources, the simulations for the case XGC-T88Y crashes after 44 ion transit times.
The slop of the plasma pressure profiles continue to change for all four cases.
There is a density depletion in the SOL region for the second and third cases at t=80. This effect results in an artificial increase of ion temperatures in the SOL region.
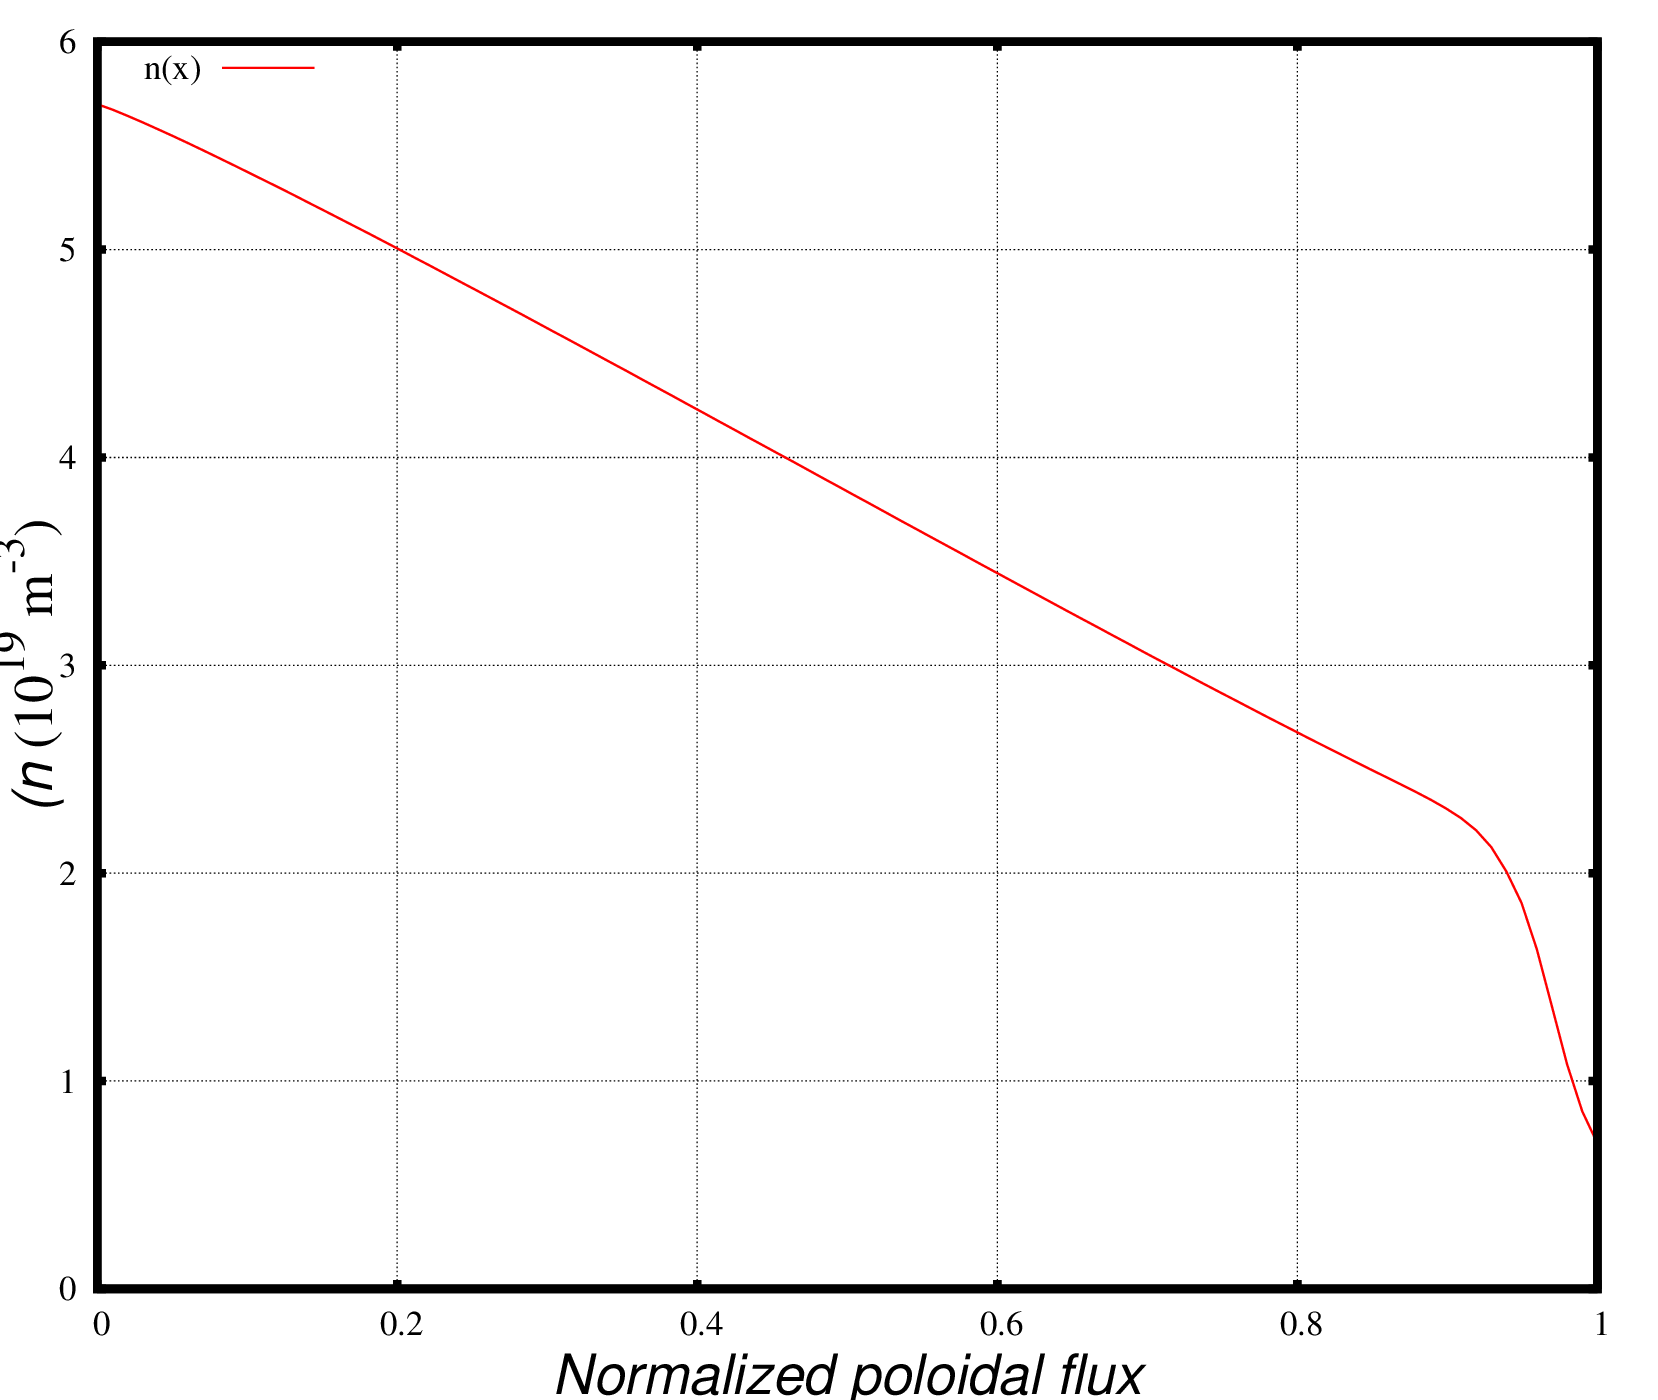
The corresponding density profile has the following shape:
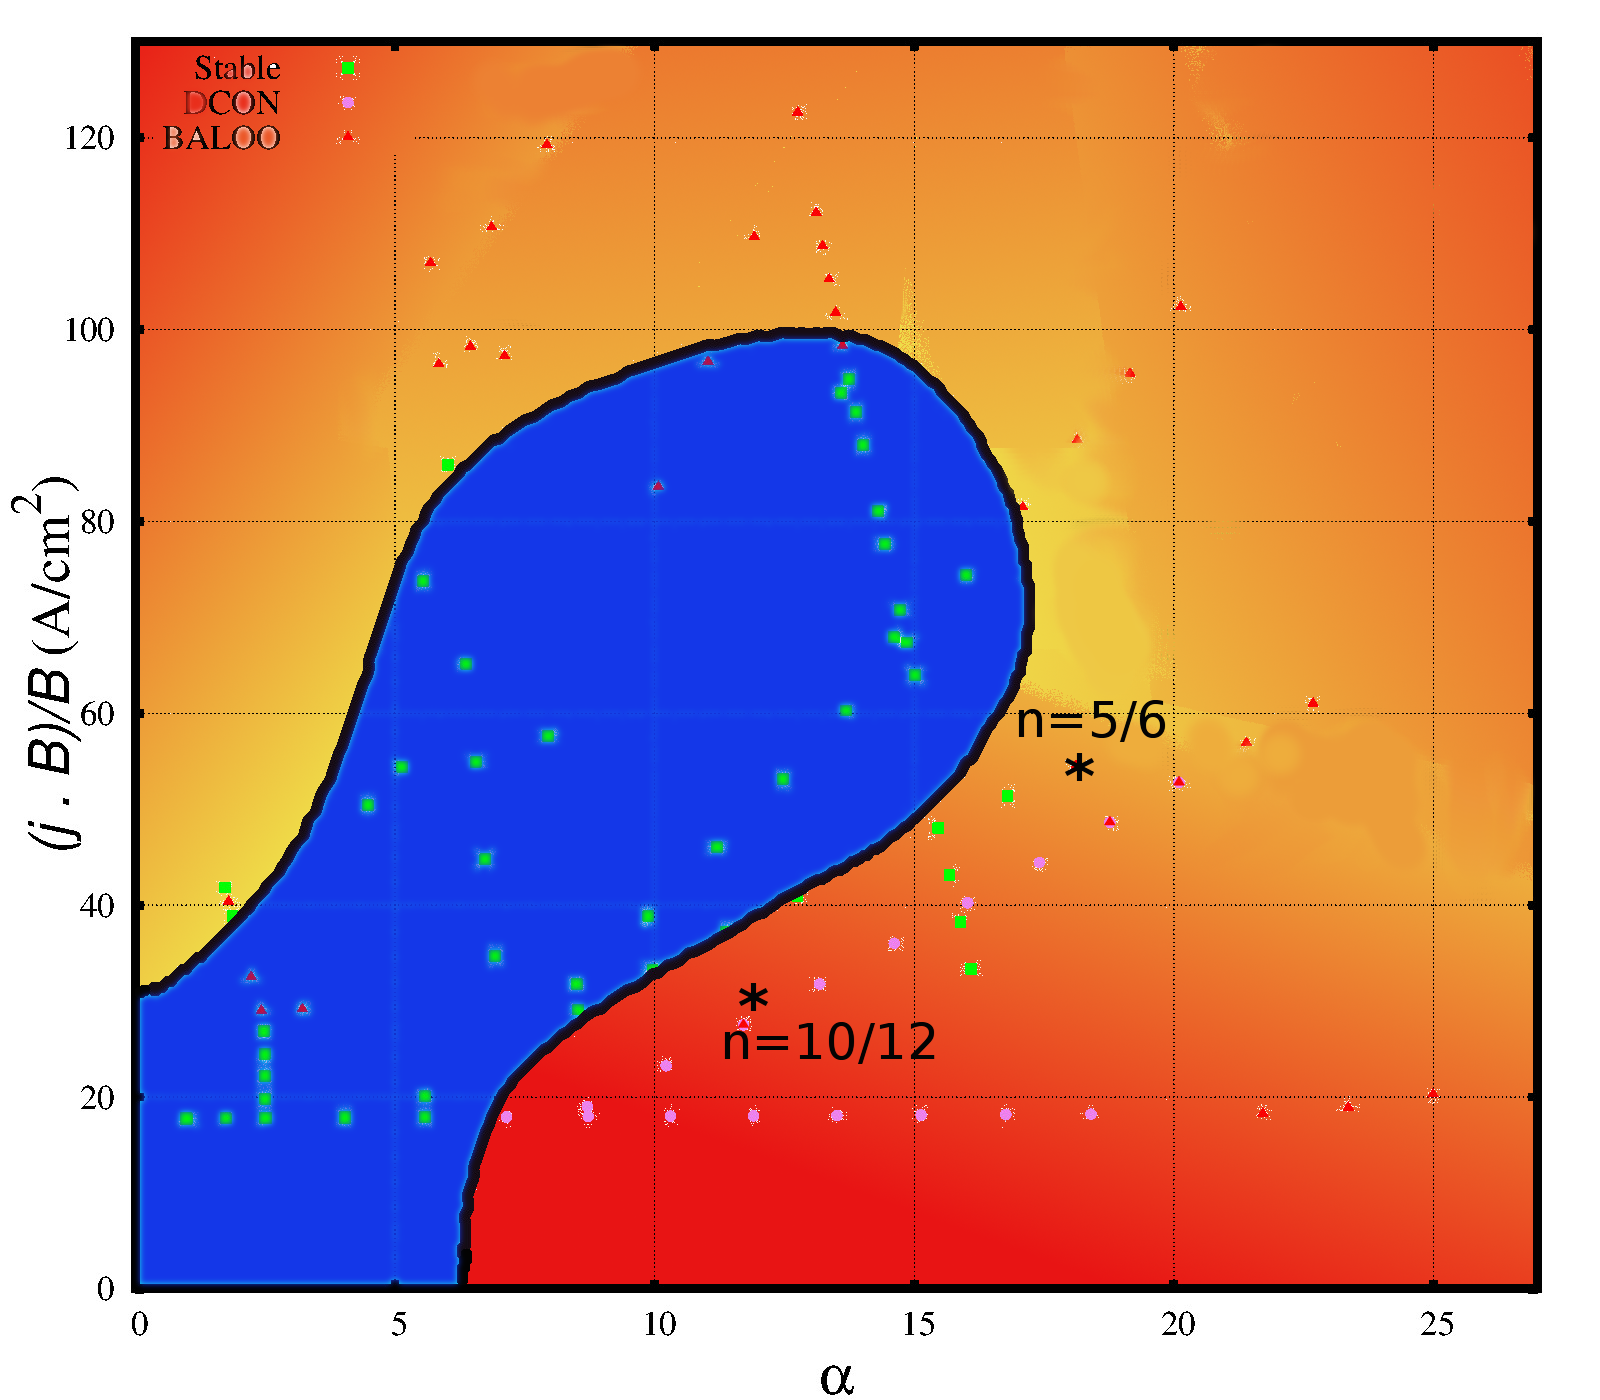
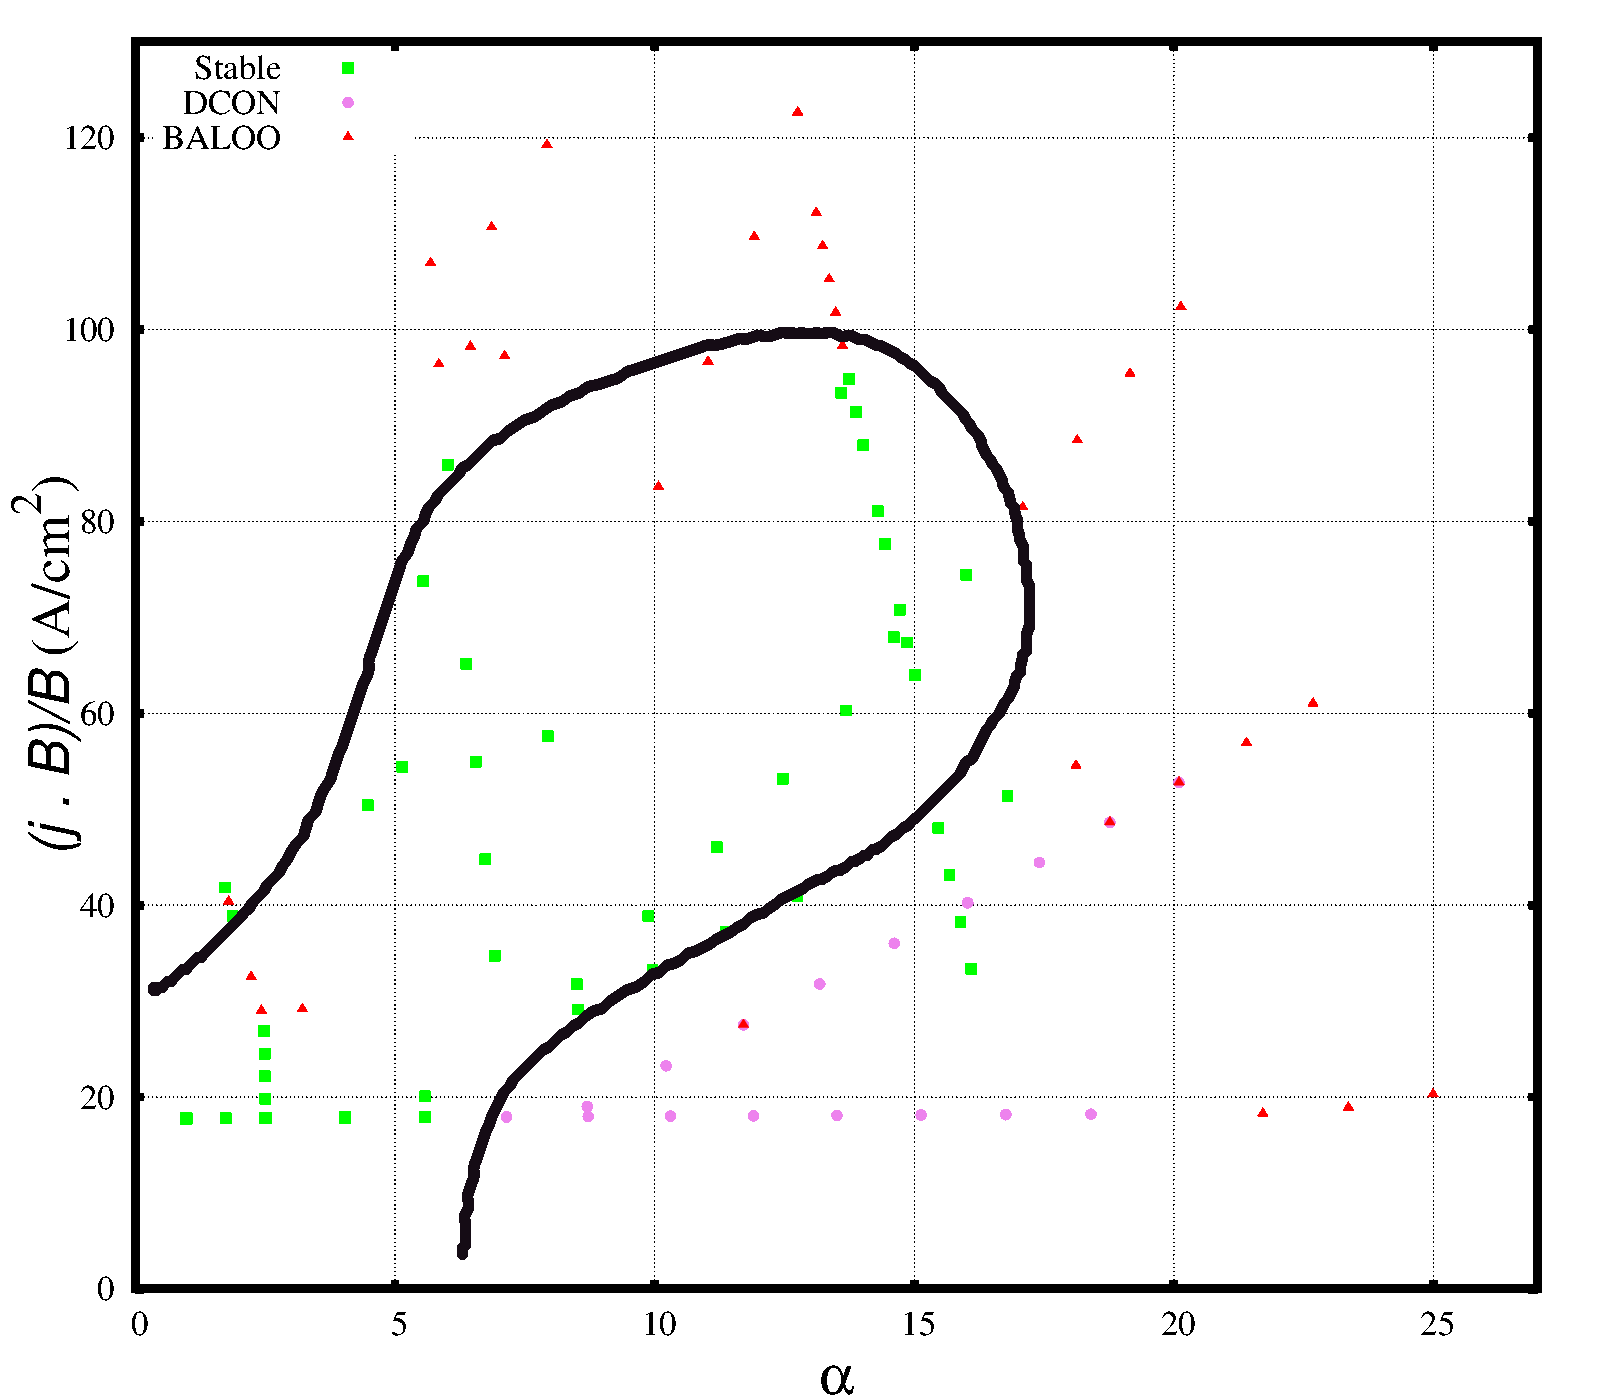
The stability map is generated by varying the nped13, tpedEV and cboot parameters the ranges [0.6:5.5], [100:1600], and [0.1:9] correspondingly. Over 150 new equilibria have been generated. The pedestal stability in these equilbria were tested using the DCON and BALOO codes. The resulting stability map is shown below:
j-alpha stability diagram for KSTAR
Here is the normalized plasma pressure gradient defined as
where is the plasma pressure, is the poloidal flux, is the plasma volume, and is the plasma major radius.
The results are valid for a particular choice of plasma parameters such as , , , and . The plasma shaping is defined according to the Bondeson’s Dee Formula. The pedestal width has been also fixed in my scan and it has been set to 0.6. The location of the H-mode pedestal top for density and temperature profiles was set to 0.94 of the normalized poloidal flux.


;
 = p_{rm eq}(psi) + dp left(tanhleft(displaystylefrac{psi-0.83}{0.2}right)+1right),")
 is the plasma pressure in the original equilibrium files that is updated with the plasma pressure
 ") , $dp$ is the gap between the equilibrium pressure
, $dp$ is the gap between the equilibrium pressure  . This formula is applied for
  from 0 to 0.83. The characteristic width of the transition region is set to 0.2. The bootstrap current profile is updated in the same way.
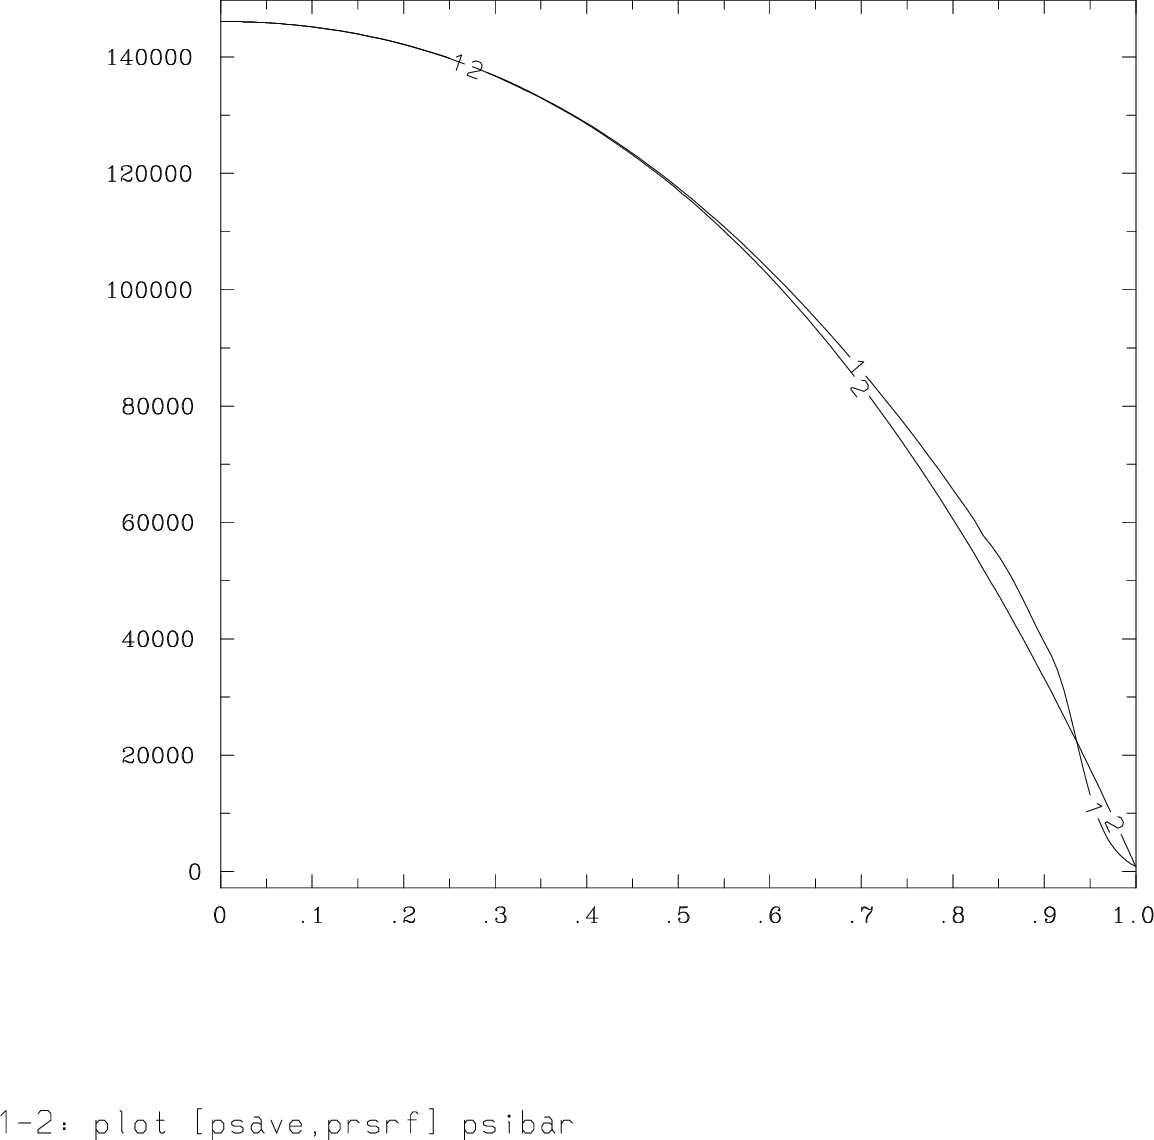
 . These assumptions are used only for the initial profiles. The XGC0 code computes the pedestal structure using the initial plasma profiles as initial conditions. Four cases that I have studied differ by the plasma collisionality. The plasma density and temperatures in each case has been modified so that the ratio
  for the initial profiles would change, but the plasma pressure
 ") remains constant. Differences in initial plasma profiles are summarized in the table below.
remains constant. Differences in initial plasma profiles are summarized in the table below.")
")
 is the normalized plasma pressure gradient defined as
 is the plasma pressure,
  is the plasma volume, and
  is the plasma major radius.
 ,
,  ,
,  , and
, and  . The plasma shaping is defined according to