The Shafranov shift effect is included through a geometric factor modifying the ion magnetic drift frequency, which varies strongly around each magnetic surface:
j is the ion specie index, Z is the ion charge, is the wave vector in the poloidal direction, s is the magnetic shear, and is the alpha MHD which is defined as
.
The alpha MHD is proportional to the Shafranov shift and the effect of the Shafranov shift can be investigated by introducing a scaling factor for the last term in the first equation above:
.
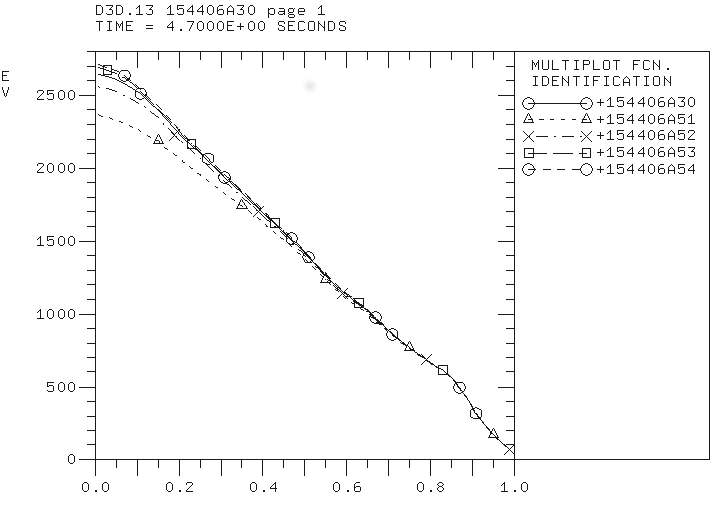
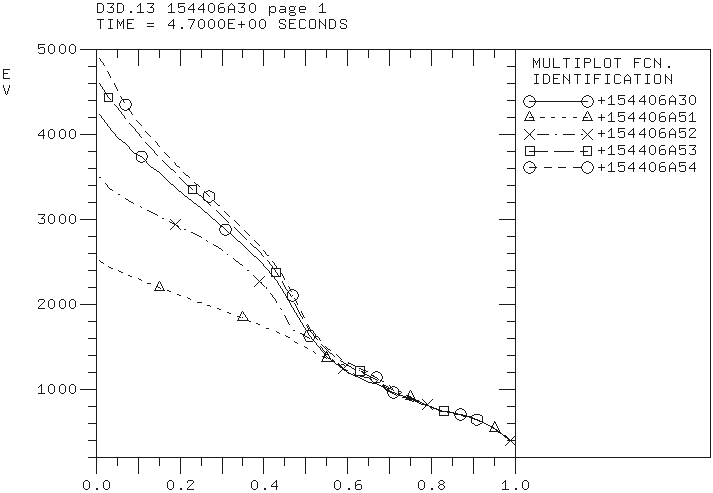
The coefficient is added to the PTRANSP namelist. Five values of are tested:
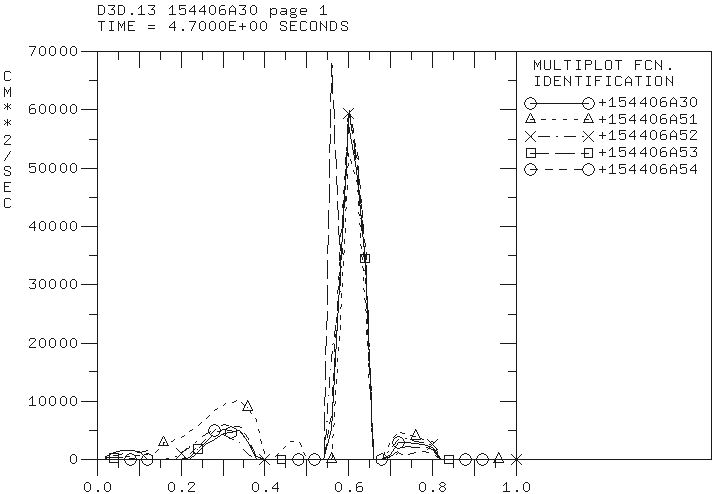
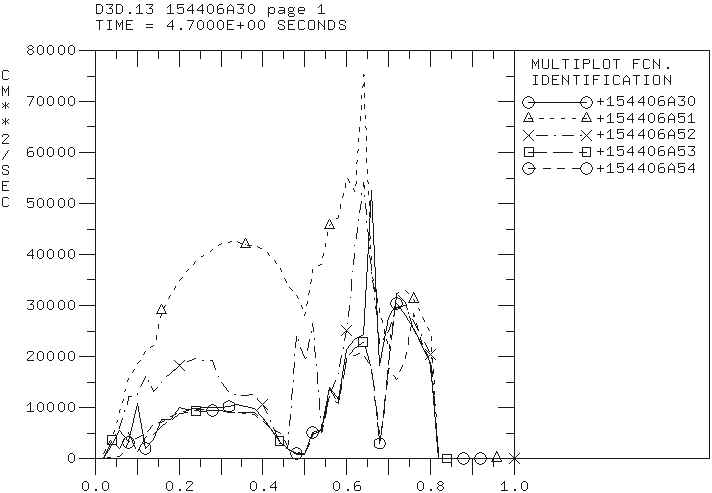
– simulation 154406A51 (dashed curve with triangles) – simulation 154406A52 (dash-dotted curve with crosses) – simulation 154406A30 (solid curve with circles) – simulation 154406A53 (dashed curve with squares) – simulation 154406A54 (dashed curve with circles)
The predicted electron (left) and ion (right) temperature profiles.
Electron (left) and ion (right) thermal diffusivity profiles computed using the Weiland component of MMM7.1.
The Shafranov shift has stabilizing effect on electron and ion channels of transport. However, the effect on the electron channel is somewhat weaker. Also, the large spike in transport in the ITB region in the electron thermal diffusivities is found weakly affected by the Shafranov shift.
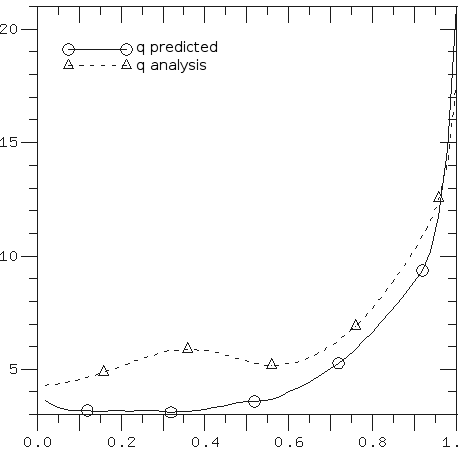
Previous simulation used prescribed time-dependent equilibrium quantities that are based on the experimental equilibrium reconstruction. Using TEQ equilibrium solver in PTRANSP eliminates additional constrains on predicted profiles. The figure below shows the predicted and reconstructed q-profiles at 5.2 sec. The q-profile from experimental has a local minimum in the region of internal transport barrier. The predicted q-profile is significantly modified with the local minimum shifted towards magnetic axis.
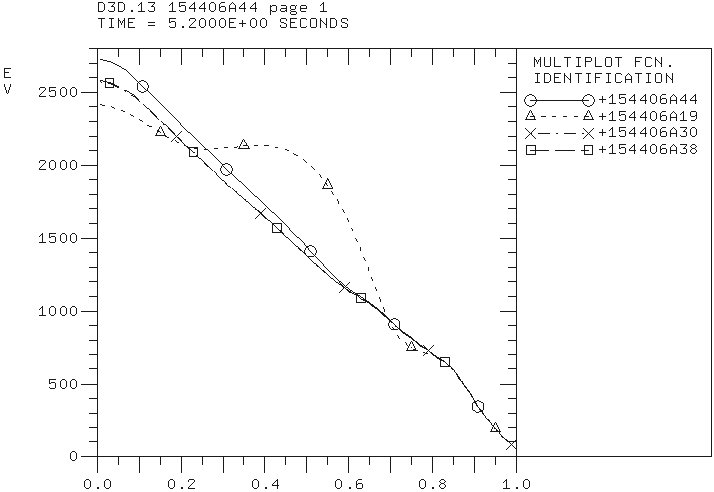
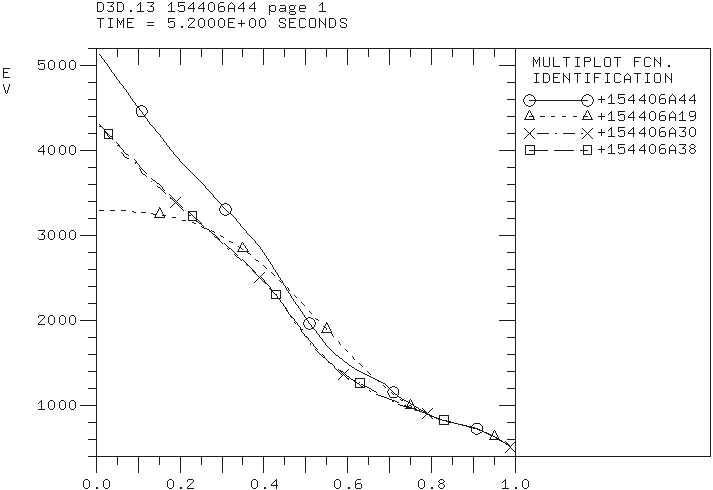
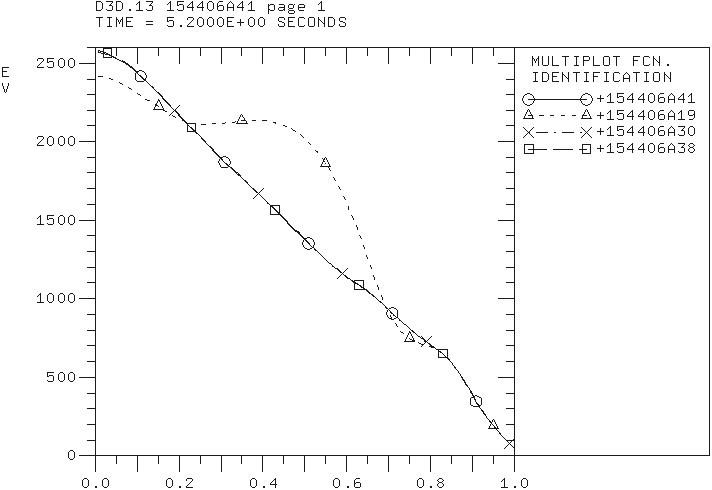
The PTRANSP simulation 1554406A44 with the ten times ExB flow shear scaling factor (FACEXB=10) is completed. A notable effect on the electron and ion temperatures is observed. The temperatures are higher comparing to the previous simulations with FACEXB=0 (154406A41), FACEXB=1 (154406A30), and FACEXB=2 (154406A38). The main conclusion from these simulations is that the experimental level of ExB flow shear is low enough to have any significant effect on the anomalous transport.
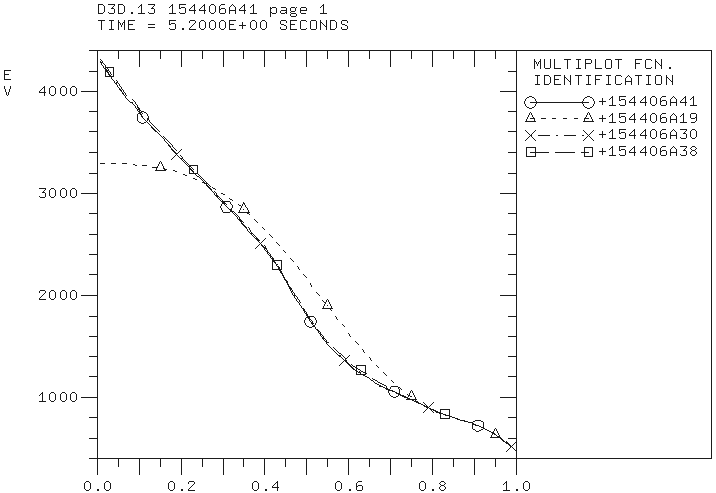
The role of the ExB flow shear on the predicted temperature profiles for the DIII-D discharge 154406 is investigated using the FACEXB scaling factor. I noticed a very small change in the predicted temperatures when this factor is set to 0 (154406A41), 1 (154406A30), and 2 (154406A38). Another simulation (154406A44) with the FACEXB factor set to 10 is also started.
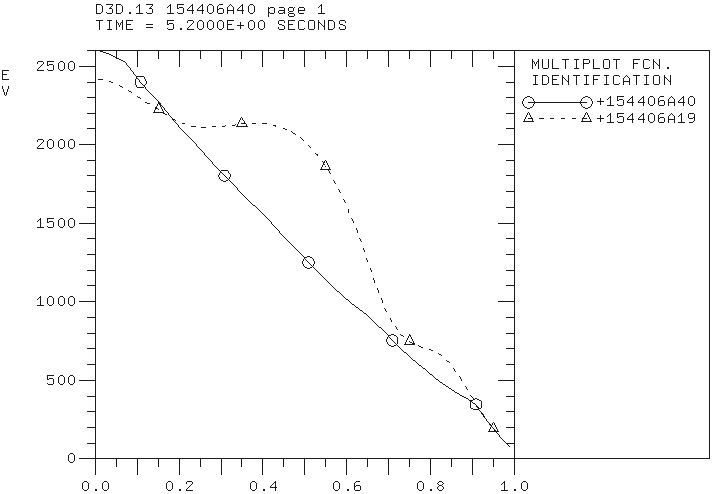
The boundary conditions have been moved from 0.8 to 0.9 in the simulation of the electron temperature profile for the DIII-D discharge 154406 (154406A40). The ion temperature is not evolved. The predicted temperature profile agree with the experimental profile at approximately the same level as in the simulation with the boundary condition set at 0.8 (154406A30).
The predicted electron temperature profile shown as a solid curve is compared with the experimental temperature profile shown as dashed curve.
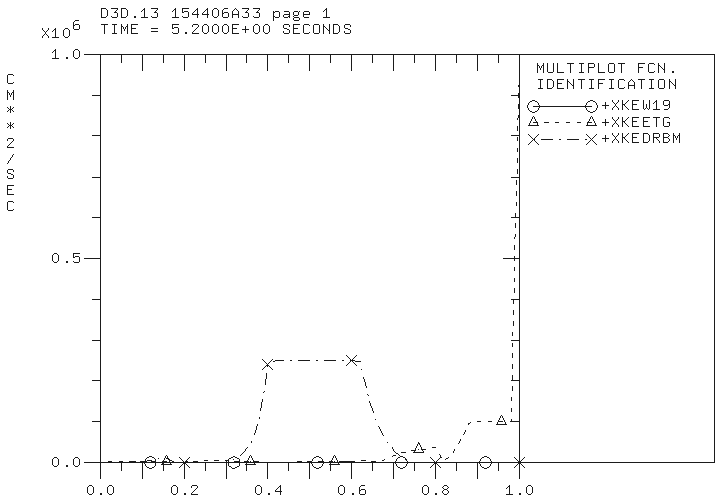
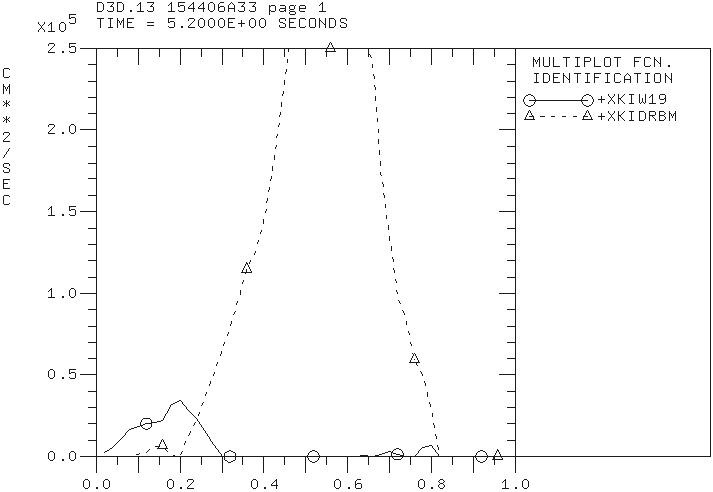
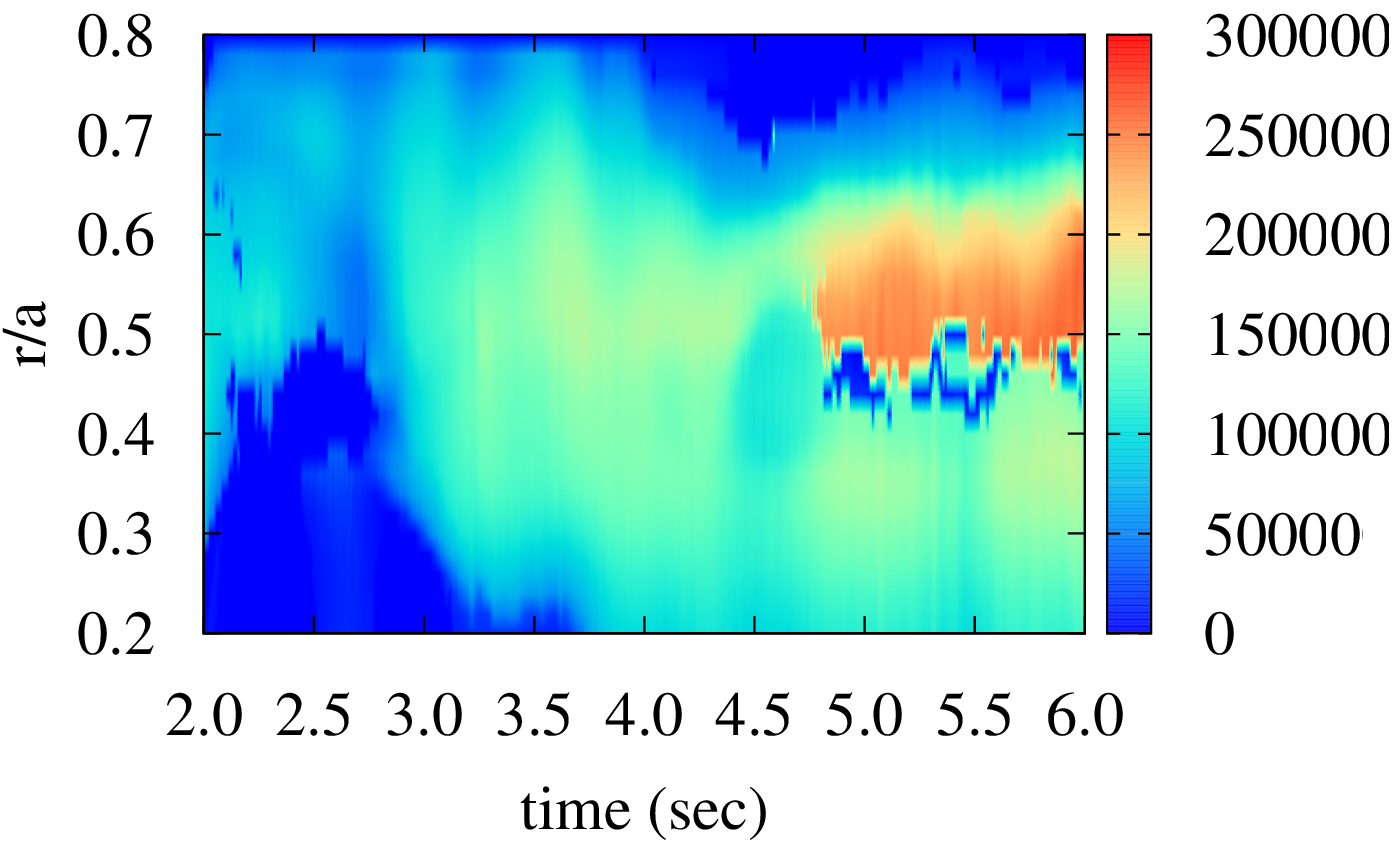
The drift resistive inertial ballooning modes (DRIBM) are destabilized by the density gradients. These modes are strongly stabilized by plasma temperatures. They are usually unstable in the plasma edge region close to the separatrix. The DRIBM modes are expected to be stable in the plasma core region of H-mode discharges. However, PTRANSP analysis of the DIII-D discharge 154406 shows that these modes are unstable in the region from 0.3 to 0.7 of normalized minor radius:
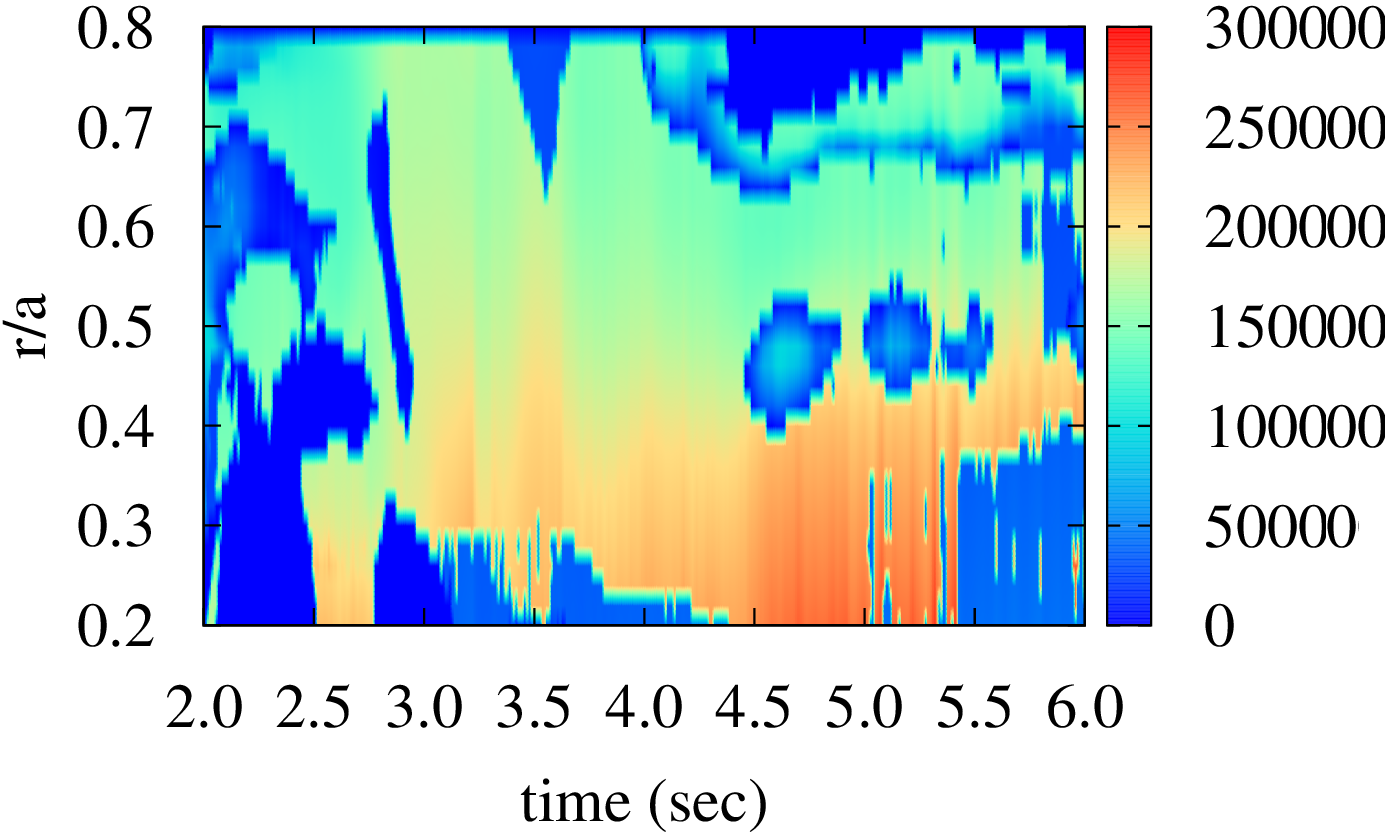
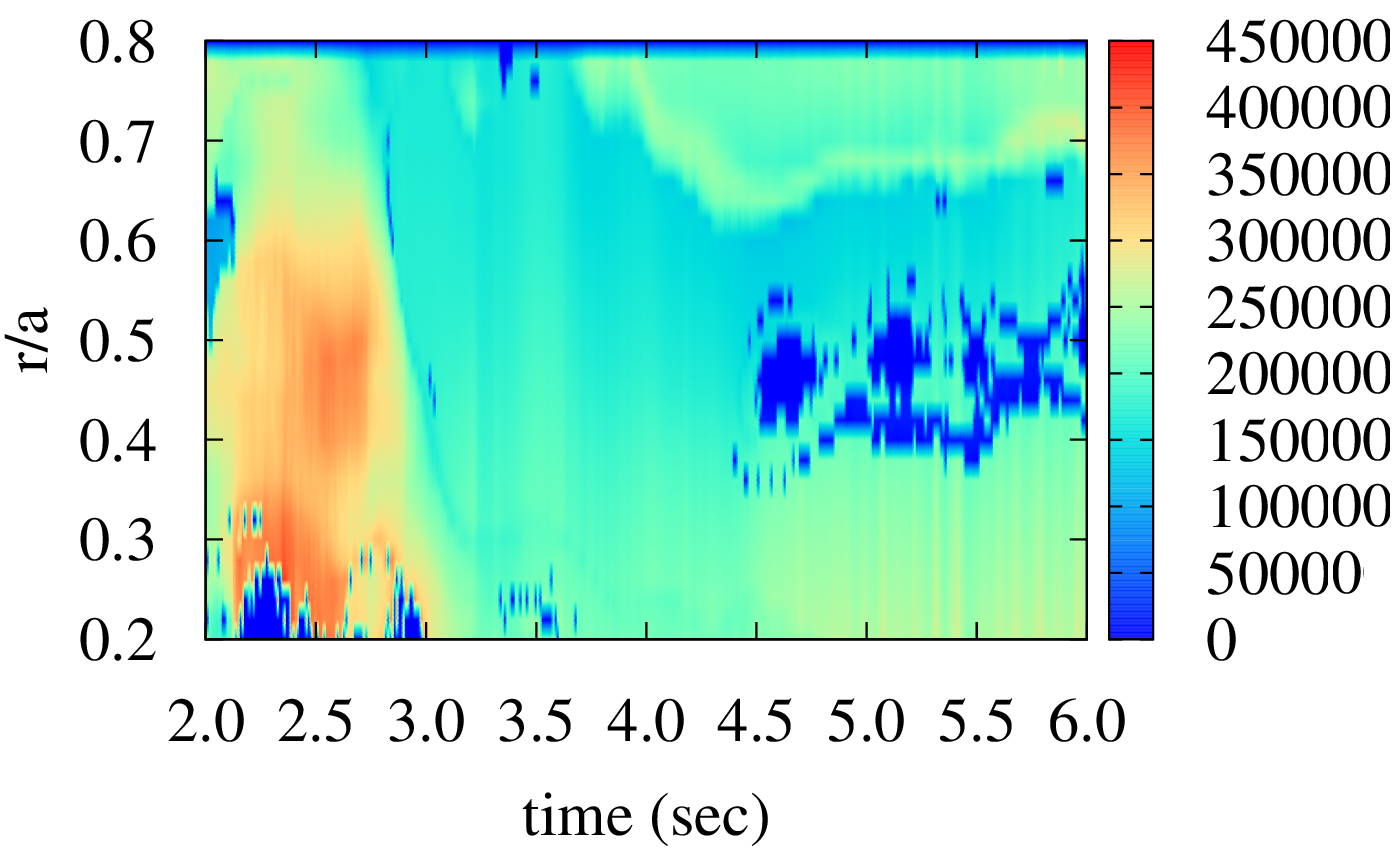
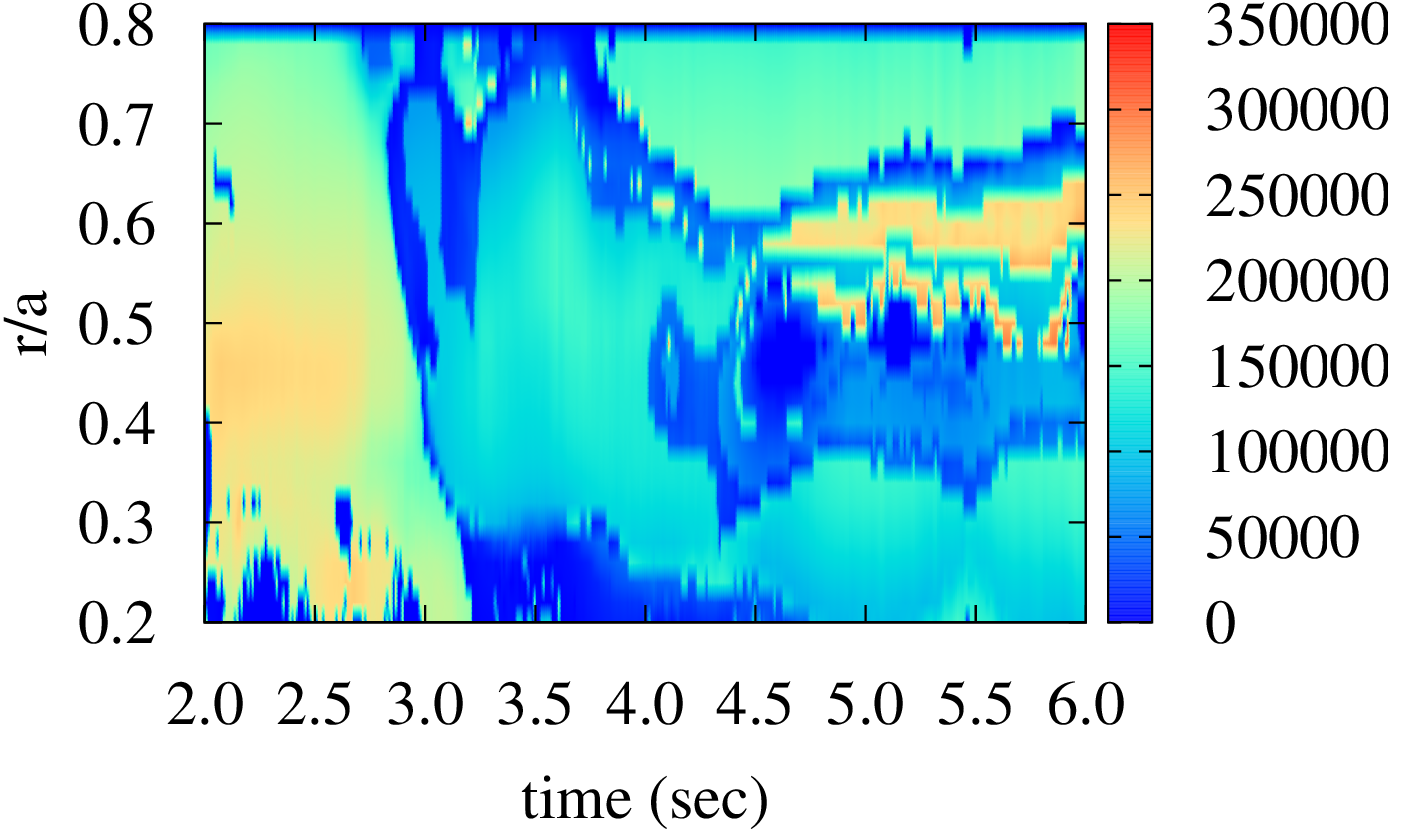
Effective electron (left) and ion (right) thermal diffusivities computed using the MMM7.1 model in the modeling of DIII-D discharge 154406 by the PTRANSP code.
The DRIBM model includes contributions from other MHD modes in addition to the drift resistive ballooning modes that can be unstable in this region. However, the validation of predicted temperature profiles hints that these modes are probably should be stable and DRIBM predicts significantly larger level of transport than expected. Additional validation of DRIBM is necessary. In particular, the effects associated with the large poloidal beta or large plasma currents such as Shafranov shift stabilization in DRIBM might need to be revisited.
Predicted electron (left) and ion (right) temperature profiles in the PTRANSP simulation of the DIII-D discharge 154406 using the Weiland, ETG, and DRIBM components of the MMM7.1 model.
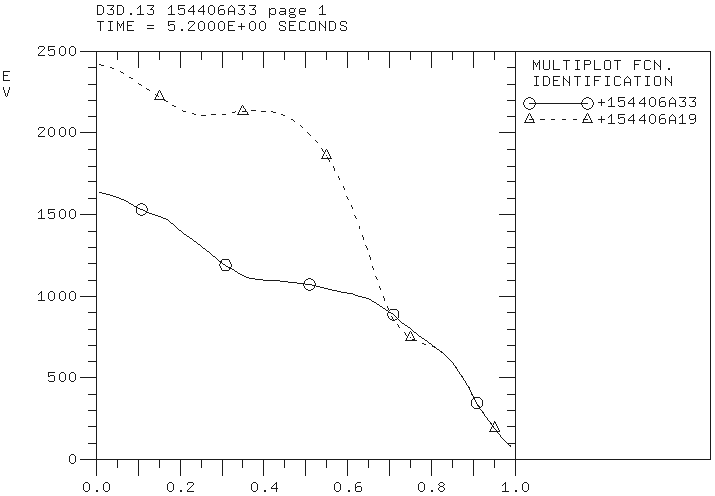
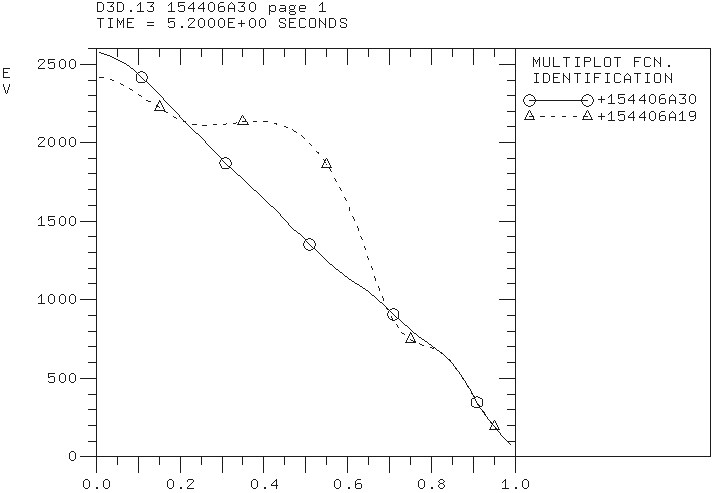
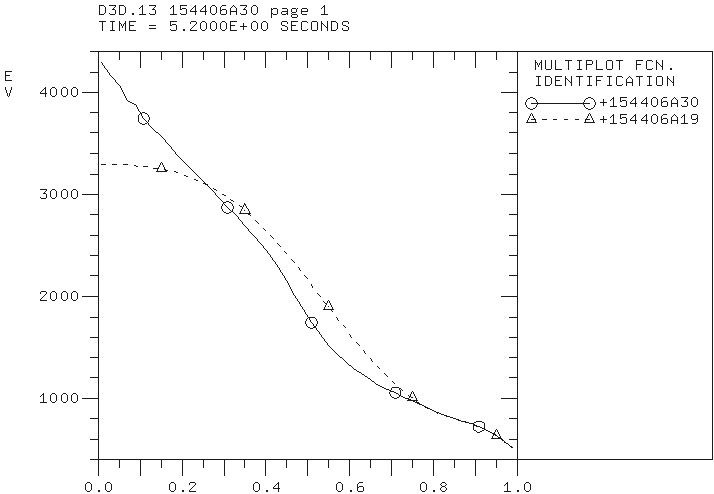
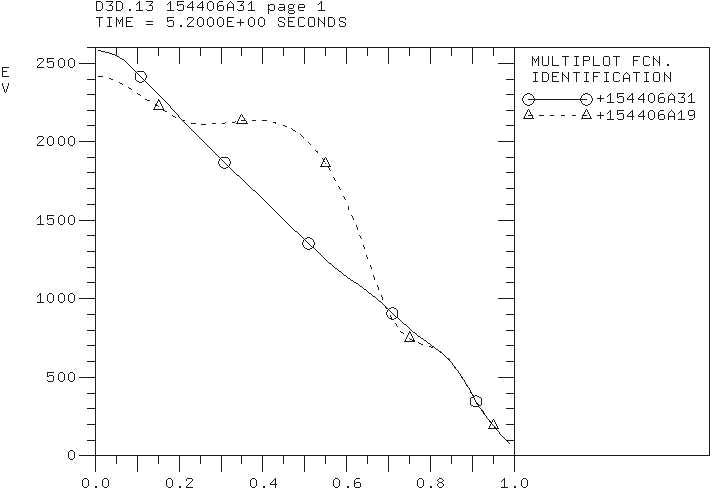
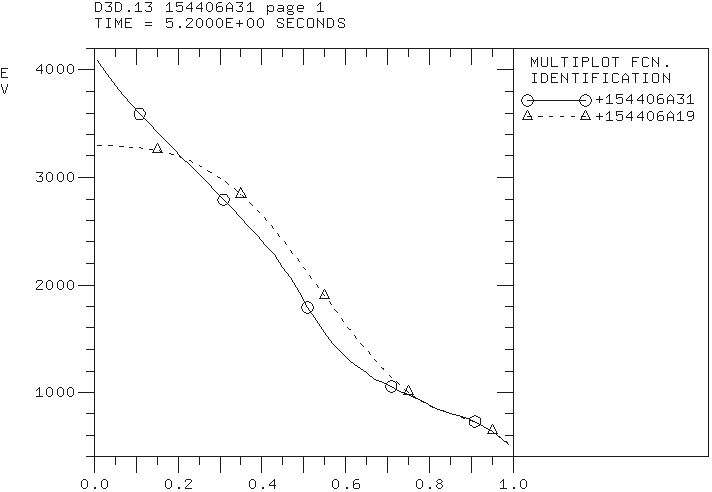
The temperature profiles are predicted using the Weiland and ETG components of the Muti-Mode Model (MMM7.1). The predicted temperature profiles are compared with the corresponding temperatures from interpretive simulations (154406A19). Four PTRANSP simulations are completed. These simulations are: (1) Only electron temperature is evolved (154406A28); (2) Only ion temperature is evolved (154406A29); (3) Electron and ion temperatures are evolved (154406A30); and (4) Electron and ion temperature as well as toroidal momentum are evolved (154406A31).
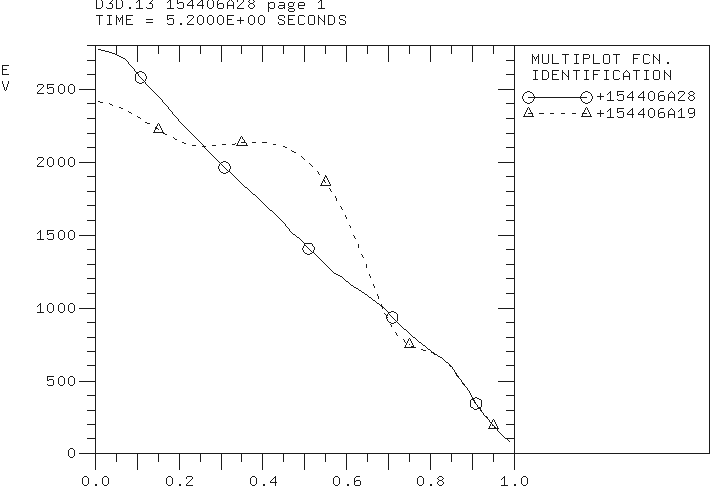
The electron temperature profile in the PTRANSP simulation 154406A28.
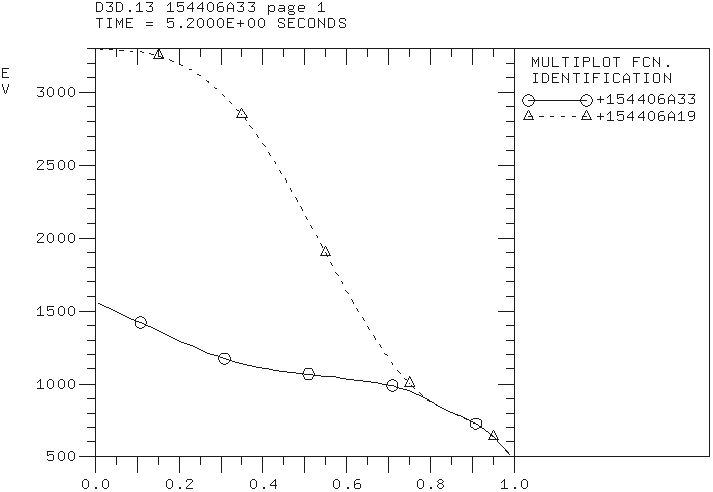
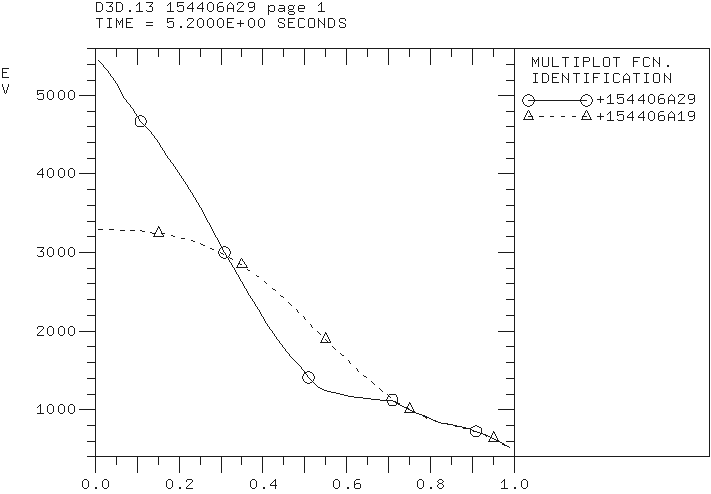
The ion temperature profile predicted in the PTRANSP simulation 154406A29.
The electron (left) and ion (right) temperature profiles predicted in the PTRANSP simulation 154406A30.
The electron (left) and ion (right) temperature profiles predicted in the PTRANSP simulation 154406A31.
It is somewhat unexpected that a that better agreement between predicted and experimental profiles is found in the simulations in which the electron and ion temperatures are evolved simultaneously. Neither simulation can accurately reproduce the location of internal transport barrier in the electron temperature profile. The reason is a rather significant electron thermal transport from both the Weiland component (TEM and ITG modes) and ETG component of MMM7.1 that destroys ITB from strong off-axis ECR heating.
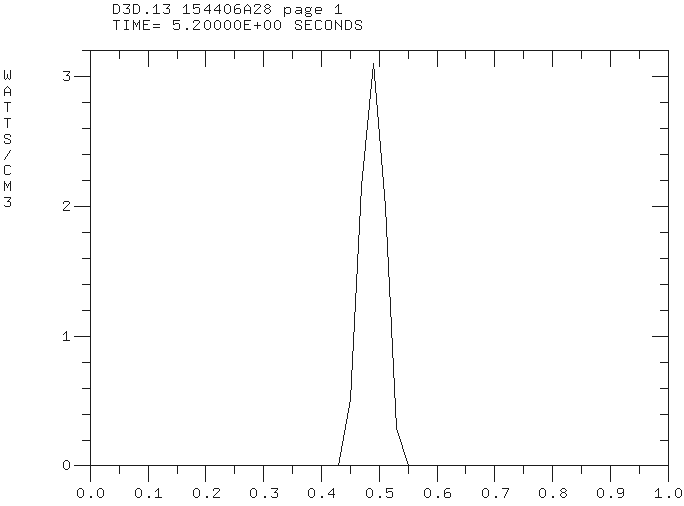
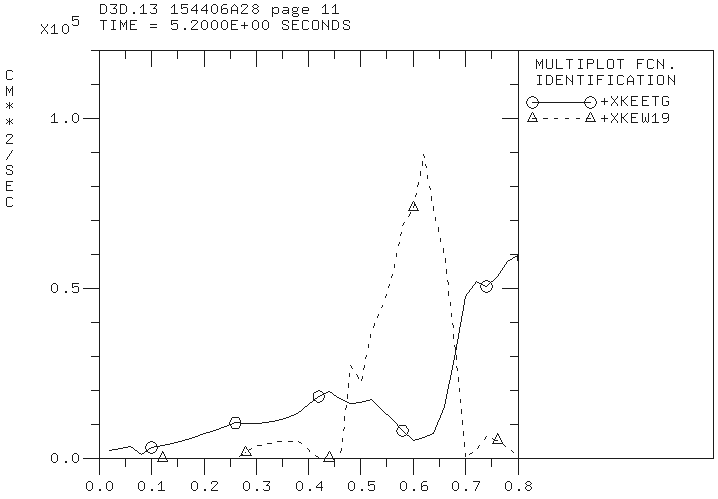
The ECR heating profile (left) and electron thermal effective diffusivities (right) computed in the Weiland and ETG components of MMM7.1 in the predictive PTRANSP simulation 154406A28.
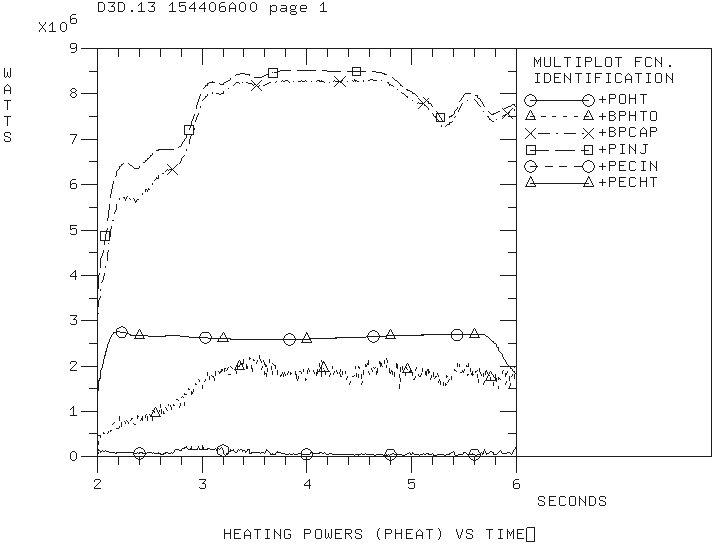
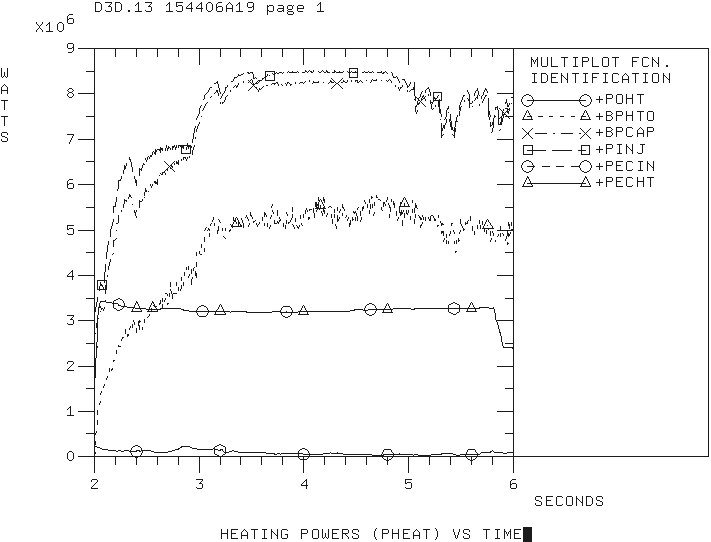
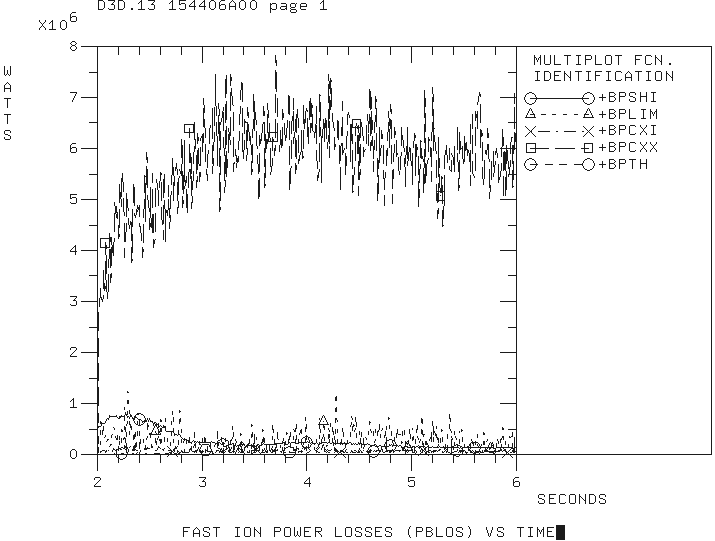
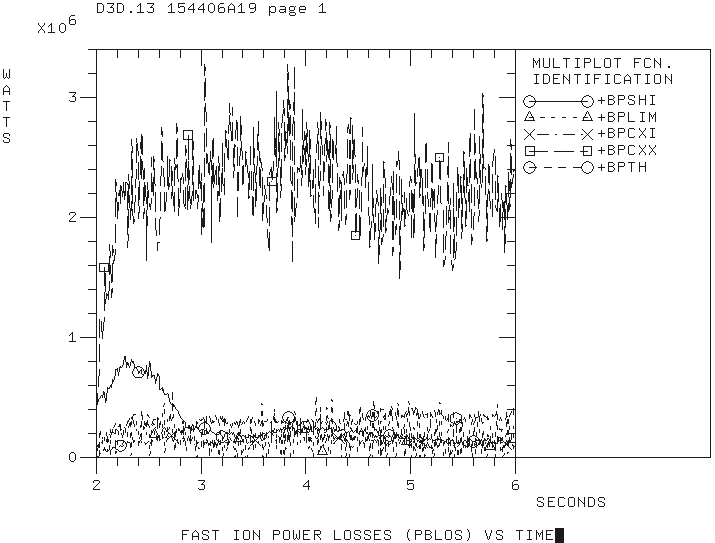
The TRANSP code is used to simulated the high poloidal beta DIII-D discharge 154406. Previous simulations that were presented by Andrea Garofalo at the TTF meeting (April 28-May 1, 2015; Salem, MA) and the H-mode workshop (October, 2015; Garching, Germany) includes the results obtained by Gary Staebler and Brian Grierson using the GLF23 and TGLF models. The ion thermal transport is found close to the neoclassical level. The electron temperature is found to be over-predicted. My new TRANSP simulations are started from the existing TRANSP run 154406R04 on the PPPL cluster. A number of simulations using various MMM7.1 parameters are performed. Both electron and ion temperatures are found to be strongly under-predicted. I have also generated new TRANSP input files using AUTOTRANSP. Some NUBEAM and ECH parameters are found different from the corresponding parameters in the 154406R04TR.DAT file. These differences resulted in significant differences in the total fast ion heating BPHTO which is related to anomalously large outside CX losses BPCXX in the simulations that are based on the run 154406R04.
Input heating powers in the simulation that is based on input from the 154406R04 input (left) and autotransp (right).
Beam losses in the simulation that is based on the 154406R04 input (left) and autotransp (right).
In order to identify minimum MHD model sufficient for nonlinear MHD analysis of KSTAR discharges, the following models in the NIMROD code were considered:
Resistive MHD
Lundquist number
The Spitzer resistivity is used
No parallel viscosity or gyro-viscosity
No particle diffusivity, hyper-diffusivity or hyper-resistivity
Resistive MHD with drifts
Parallel viscosity and gyro-viscosity are enabled
Particle diffusivity is enabled
No hyper-diffusivity
Two-fluid MHD
Two-fluid two-temperature MHD
Equilibria generated for the BOUT++ stability analysis and provided by Minwoo have used in this NIMROD analysis.
The simulation results below are given for the equilibriun number #3 from the set of equilibria obtained from Minwoo Kim on August 31. The NIMROD grid in these simulation is 72×512 with polynomial degree of 6.
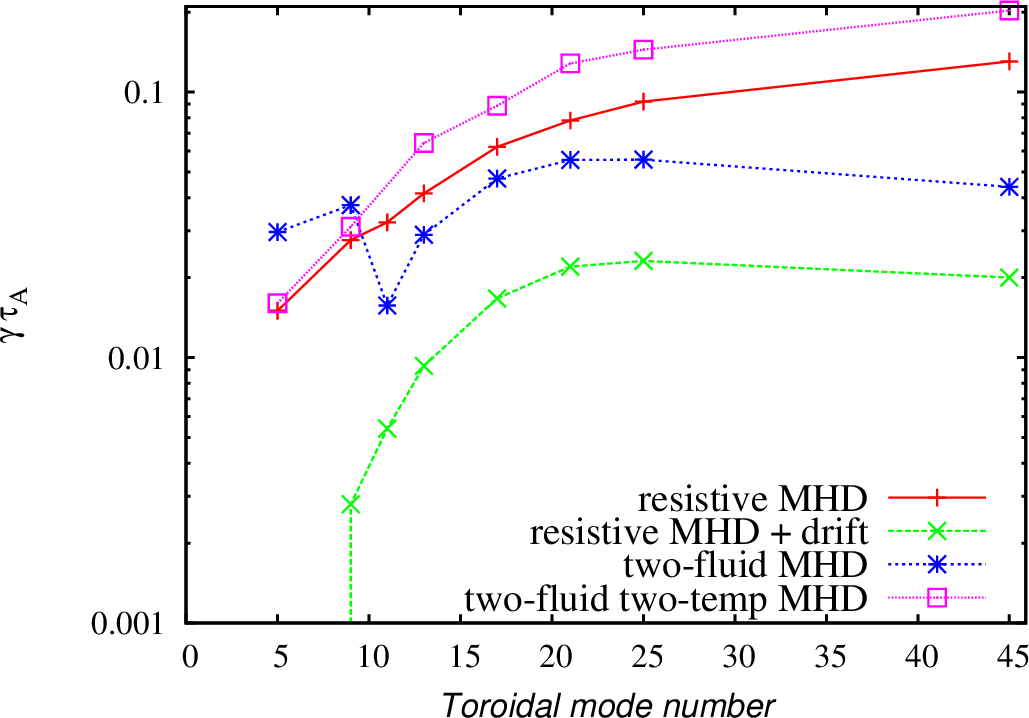
Normalized growth rates as functions of toroidal mode numbers.
The spectrum of the most unstable toroidal modes is different comparing to the predictions produced by Minwoo using the BOUT++ code. The ELM model that Minwoo uses in his simulations is somewhat similar to the restive MHD model with drifts in the NIMROD code. The NIMROD results are very moderately peaked around n=20-30, while the BOUT++ results showed the pecking for lower toroidal mode numbers. The two fluid results in NIMROD show better peaking for n=20-25. However, the modes remain rather unstable for n=45. The nonlinear simulations that would include first 45 toroidal modes might still be underresolved. For the two-fluid nonlinear NIMROD simulations, it is better to select equilibrium with the pressure profiles somewhat more relaxed in the H-mode pedestal region and with the larger bootstrap fraction so that lower n modes are more unstable.
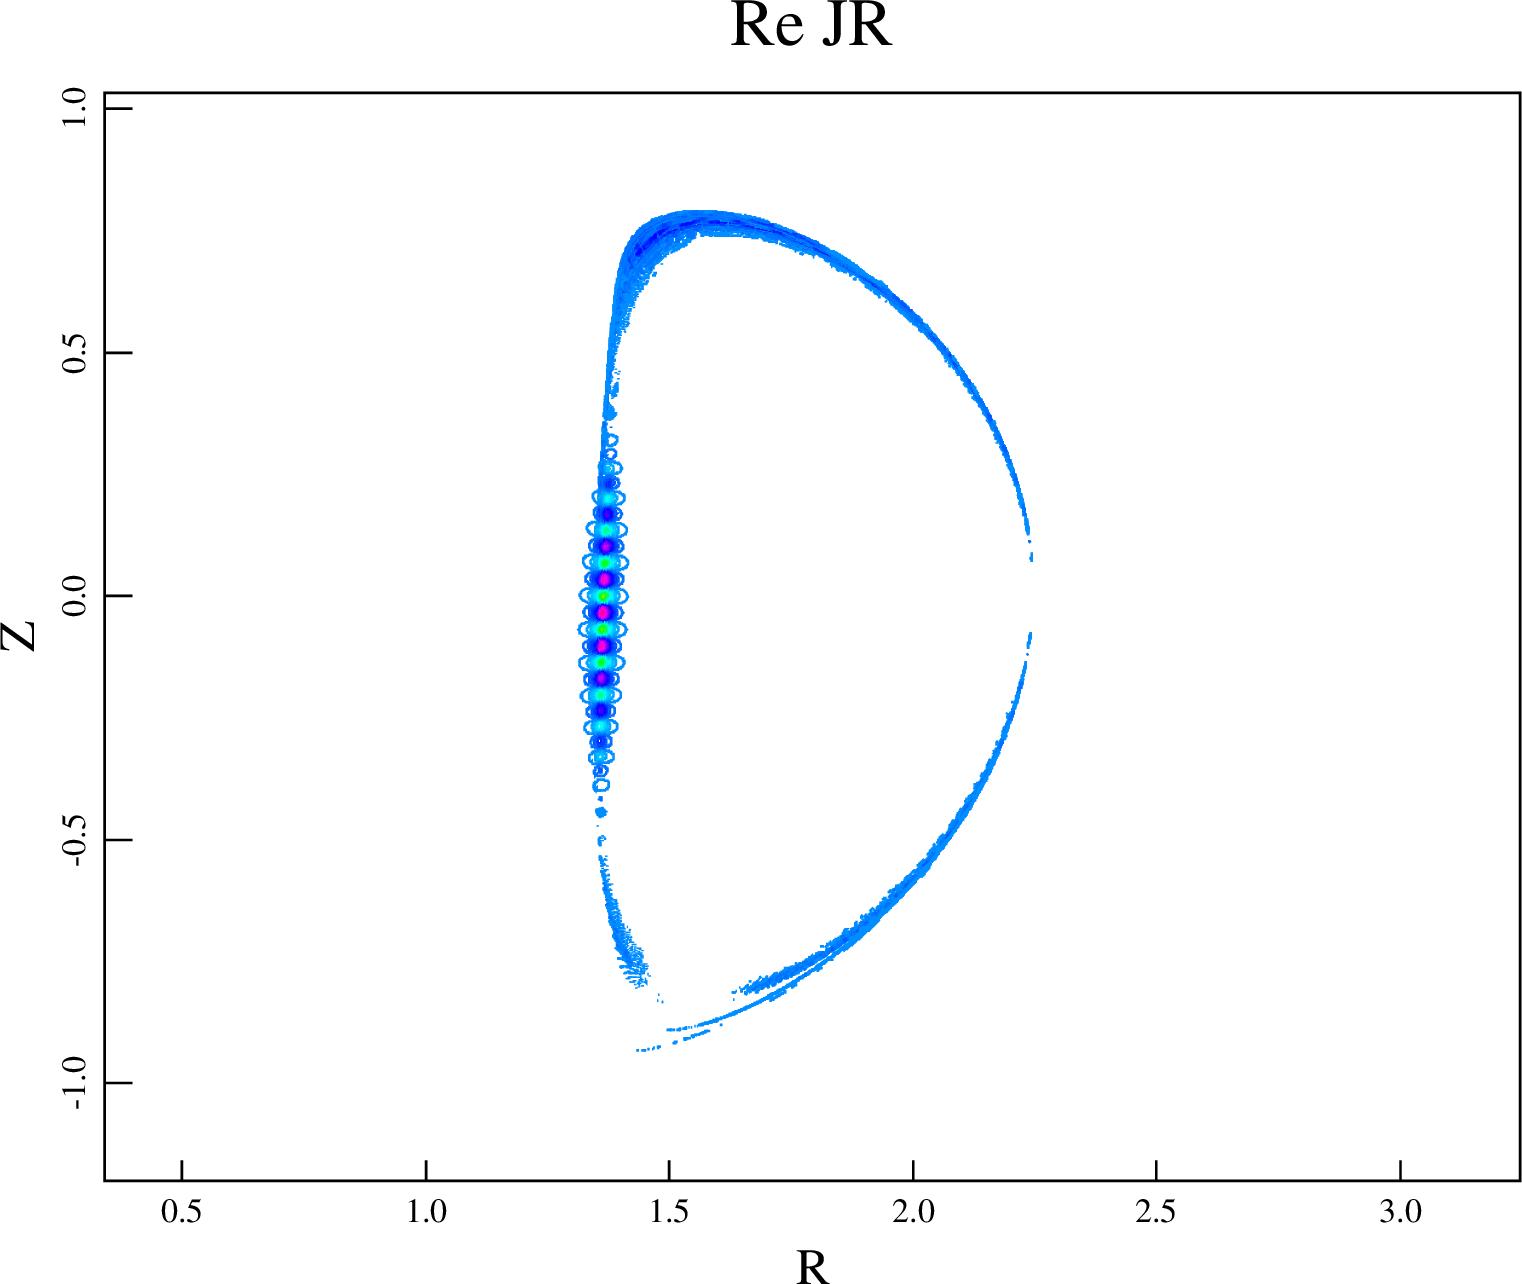
The eigenmode structure for low- and high- toroidal mode numbers are found different in the two fluid simulations. The unstable lower toroidal mode numbers are found to be localized in the high filed side region, while the higher toroidal mode numbers are found to have more ballooning like nature. The transition between these two distinguishably different regions is found around n=9.
Mode structure for n=5
Mode structure for n=17.
The inclusion of two-temperature effects is found to affect the mode sprectrum and mode structure. The toroidal mode number of the most unstable modes is larger than the maximum toroidal mode number investigated in this study.
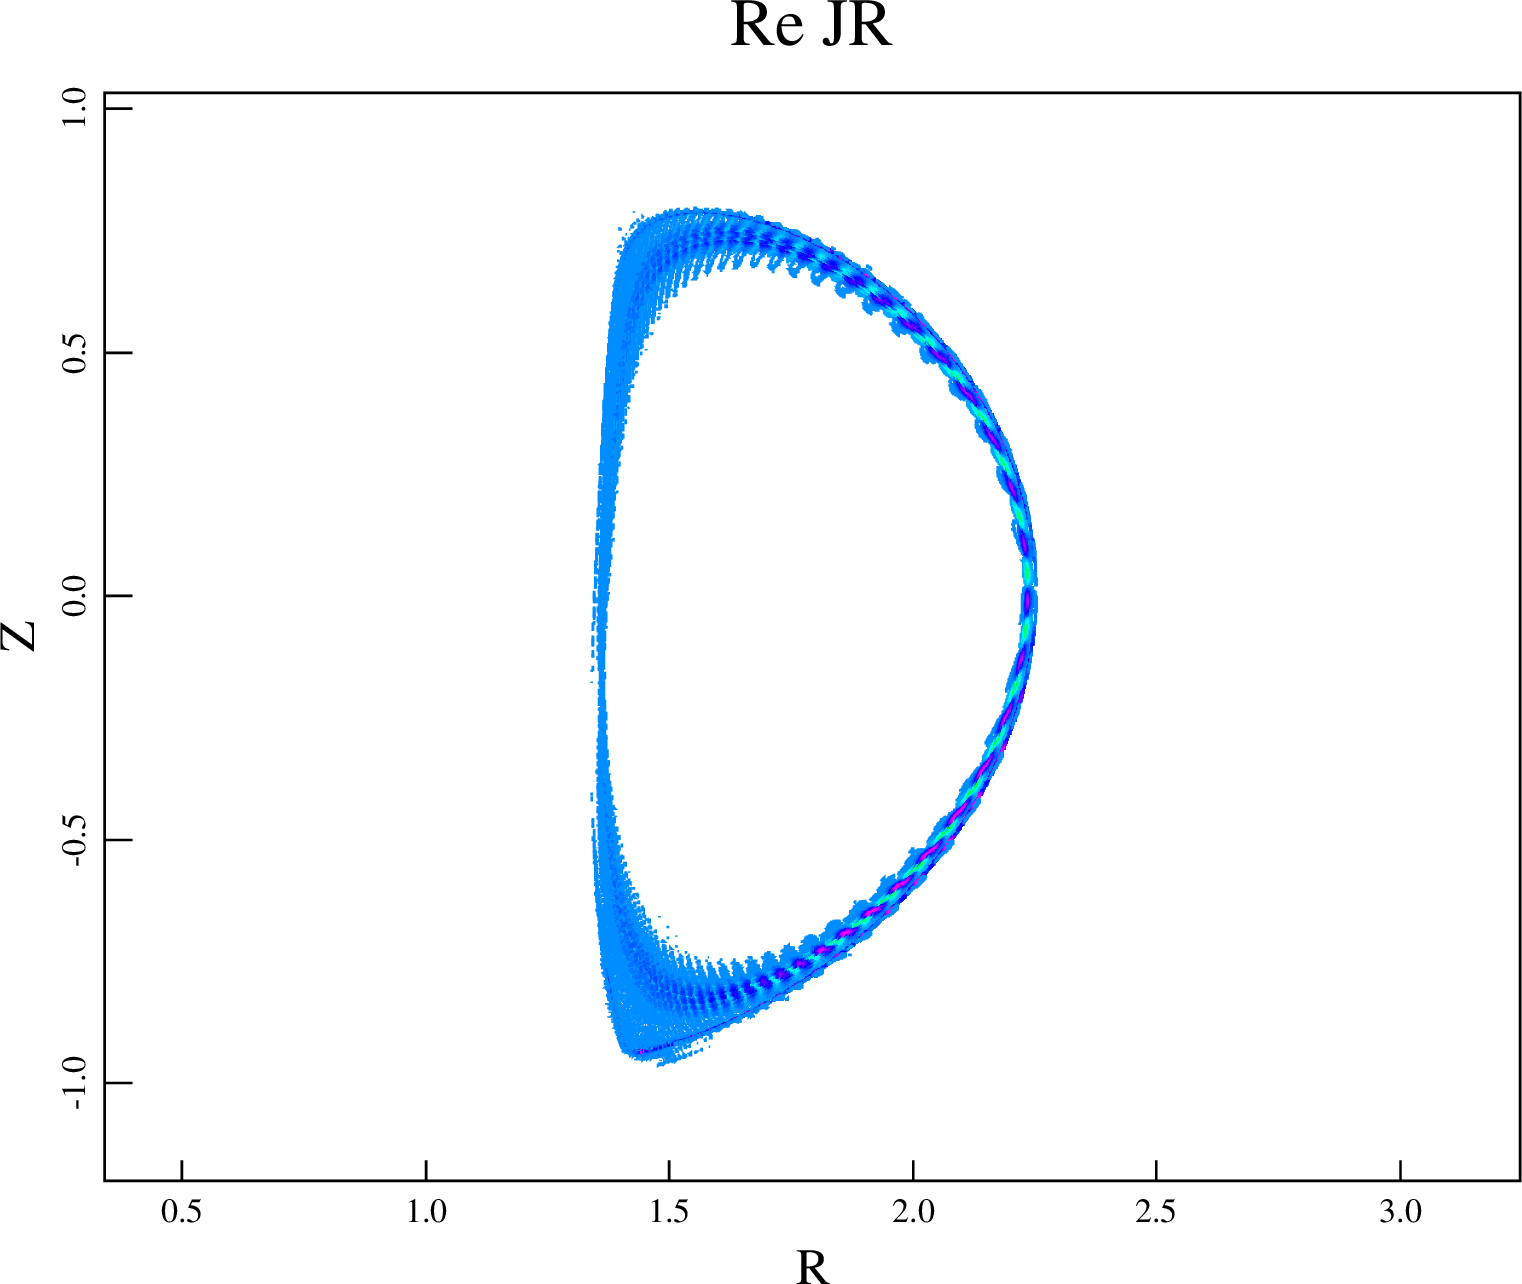
Pressure perturbations for n=17 found in the two-fluid NIMROD simulation.
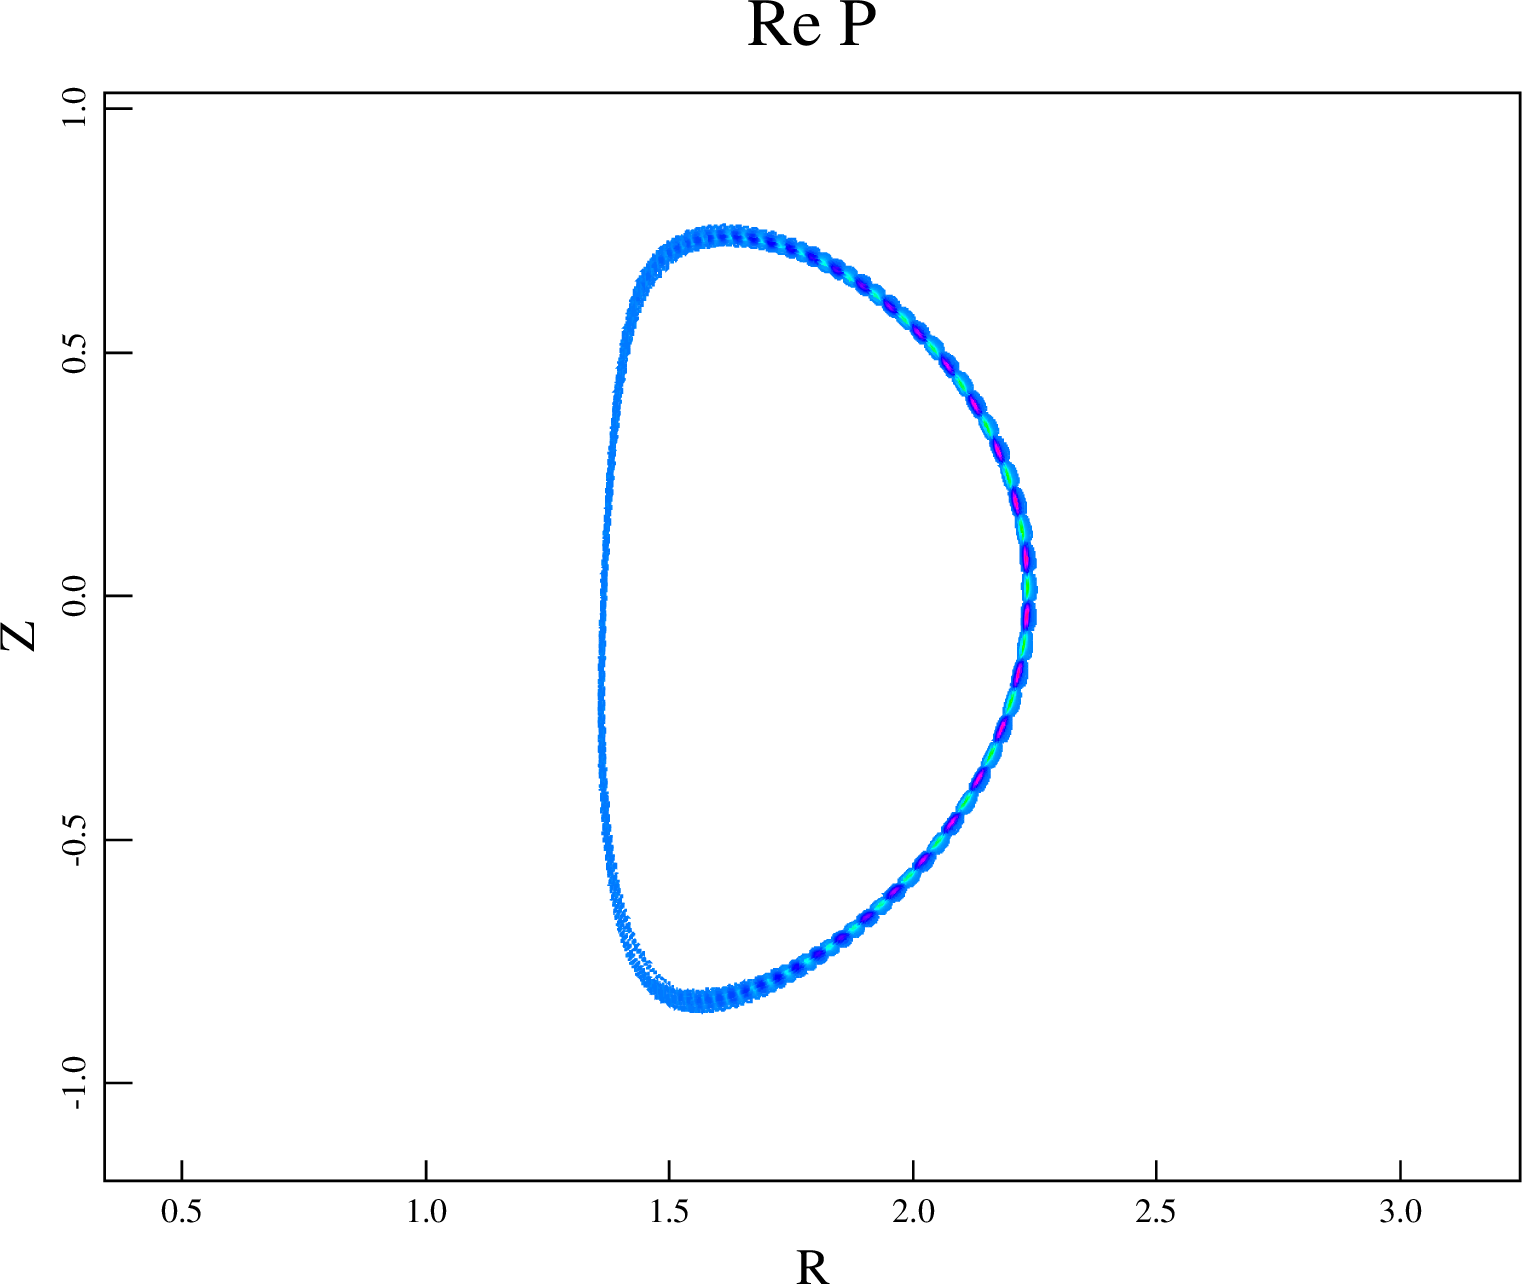
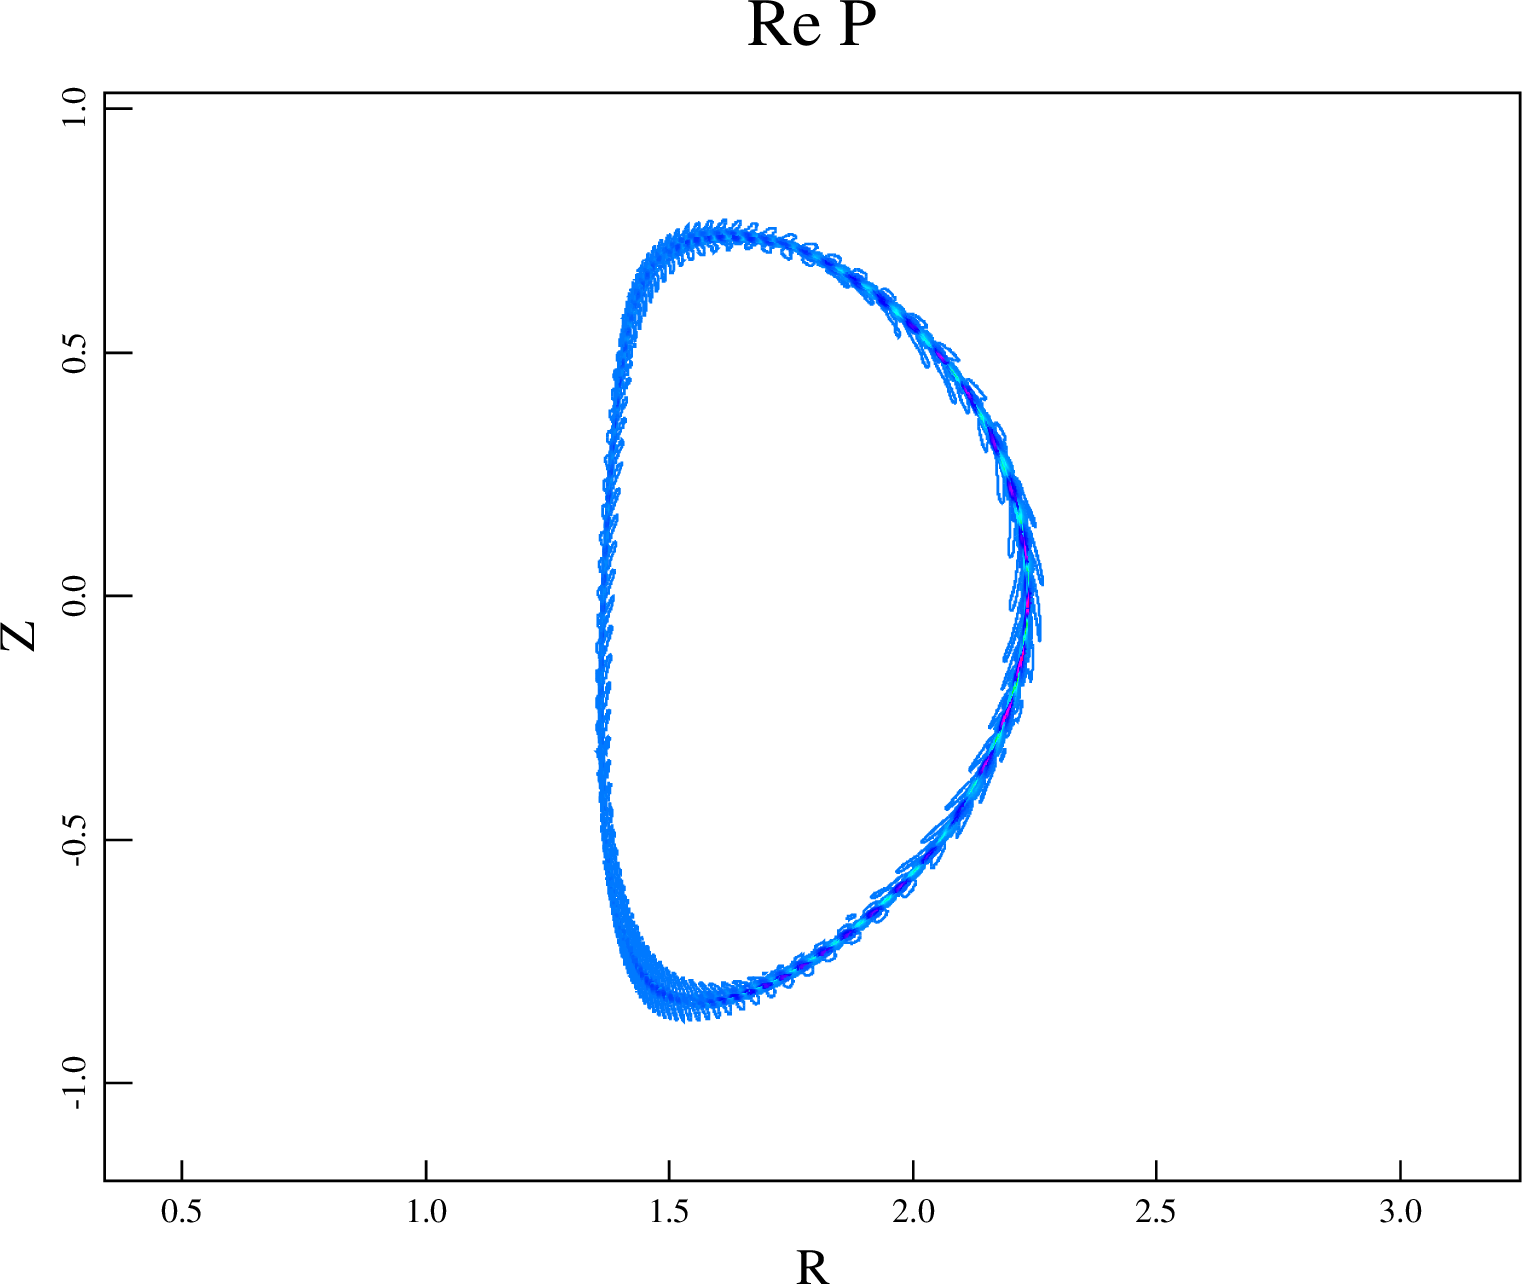
Pressure perturbations for n=17 found in the two-temperature two-fluid NIMROD simulation.
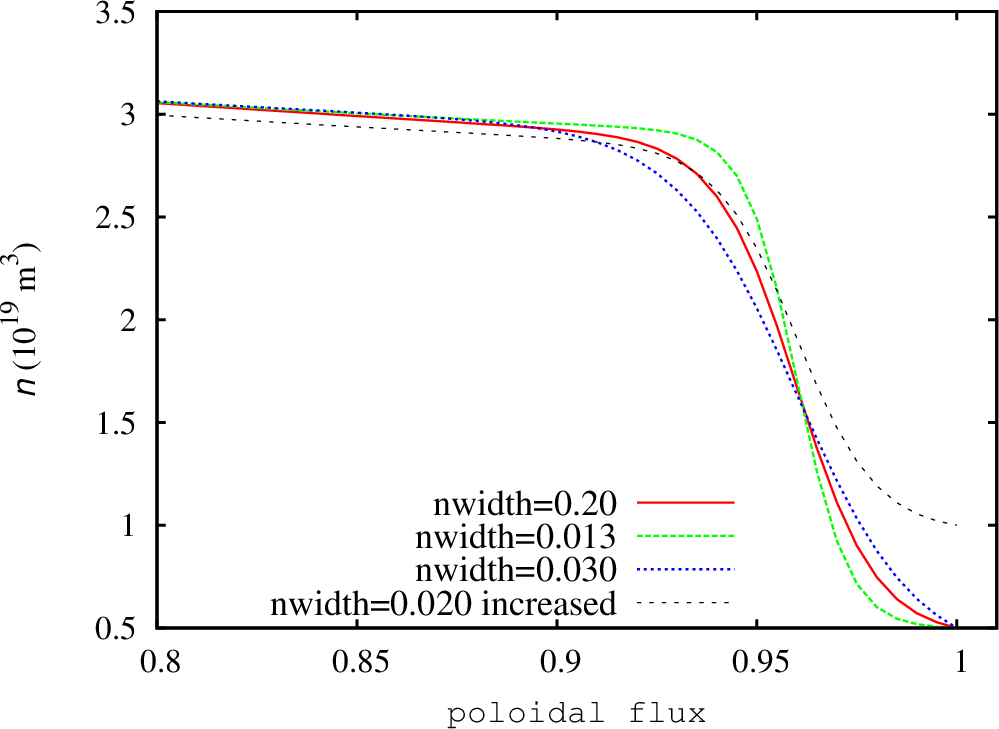
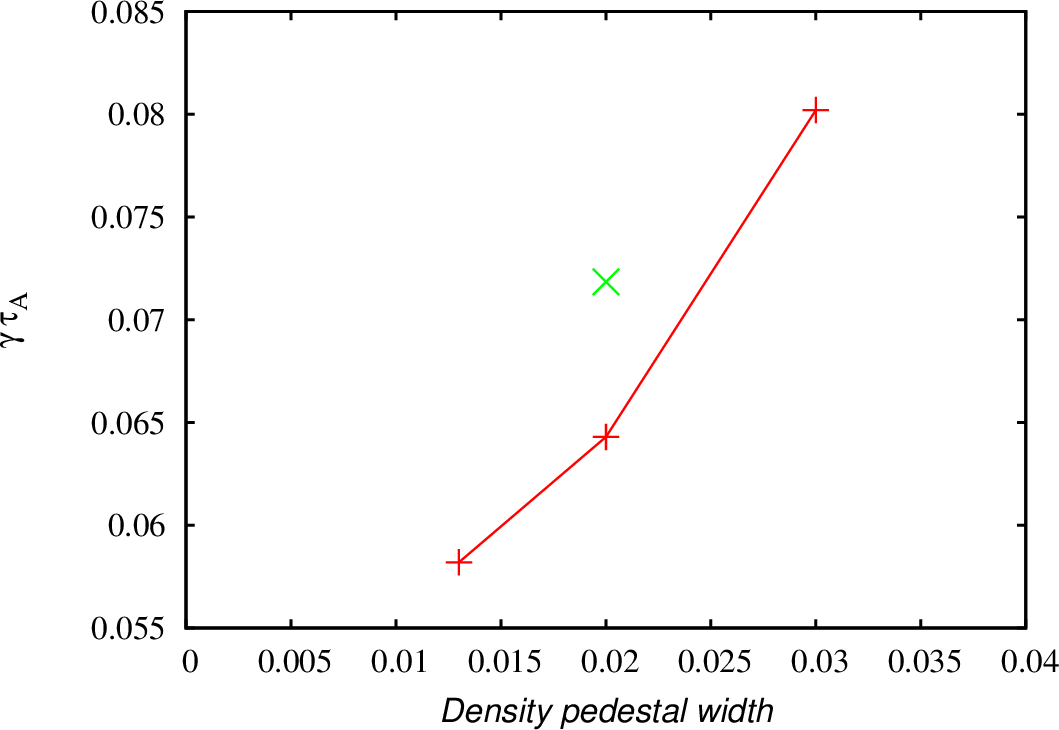
The modes found in the two-temperature NIMROD simulations are sight more shifted towards the pedestal top comparing to the modes found in the two-fluid simulations. It looks like that the inclusion of two-temperature effects destabilizes a different types of modes comparing to the modes found in the two-fluid simulations. In order to investigate the properties of these modes, the density profiles in the original equilibrium has been altered so that the density gradient in the pedestal region has been changed. The pressure profile is not affected by this change. The density width has been changed from 0.013 to 0.03 in this scan. In addition, the density at the separatrix has been increased to investigate how this change will effect the growth rates in two-temperature two-fluid simulations. Note that the resistivity in the density width scan remains modestly affected. However, the resistivity in the simulation with the increased separatrix density is strongly effected because the separatrix temperature has been reduced to keep the pressure profiles unchanged.
Pedestal density profiles.
The growth rates for the first three cases are found comparable to each other in the resistive MHD and two-fluid simulations. The growth rates for the fourth case are found significantly larger than the growth rates in three other cases in the resistive MHD NIMROD simulations. It is also found that the the increased density gradient result in lower growth rates in the two-temperature NIMROD simulations. Such behavior is typical for ITG modes that are destabilized when the ratio of temperature gradient to the density gradient is increased.


")
 is the wave vector in the poloidal direction, s is the magnetic shear, and
  is the alpha MHD which is defined as
  .
. }\alpha_m\sin^2\theta\right)") .
.}") is added to the PTRANSP namelist. Five values of
is added to the PTRANSP namelist. Five values of } = 0.0") – simulation 154406A51 (dashed curve with triangles)
– simulation 154406A51 (dashed curve with triangles)} = 0.5") – simulation 154406A52 (dash-dotted curve with crosses)
– simulation 154406A52 (dash-dotted curve with crosses)} = 1.0") – simulation 154406A30 (solid curve with circles)
– simulation 154406A30 (solid curve with circles)} = 2.0") – simulation 154406A53 (dashed curve with squares)
– simulation 154406A53 (dashed curve with squares)} = 4.0") – simulation 154406A54 (dashed curve with circles)
– simulation 154406A54 (dashed curve with circles)