
The effect of plasma density and q profiles is investigated for the DIII-D discharge 164410
The density profiles and the plasma equilibrium are not evolved in our TRANSP simulations of the DIII-D discharge 164410. Any experimental uncertainties for these two quantities can affect the predicted electron and ion temperature profiles. The experimental q and ne profiles at the times of interest are given below.
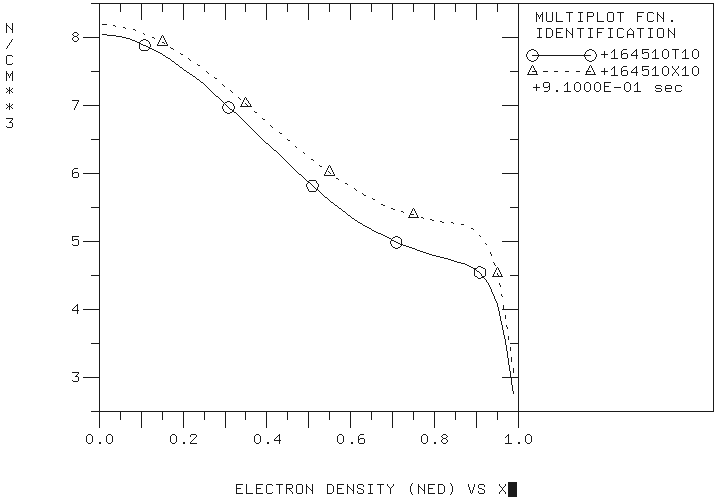
The electron density profiles at 4.1 sec (dashed curve) and 5.01 sec (solid curve).
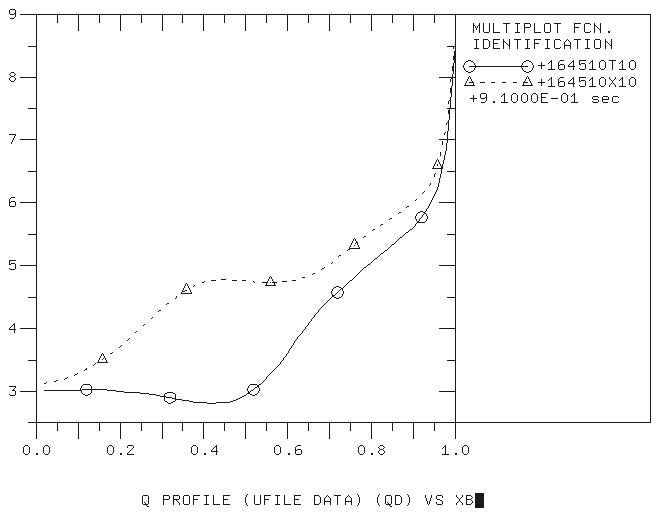
The q profiles at 4.1 sec (dashed curve) and 5.01 sec (solid curve).
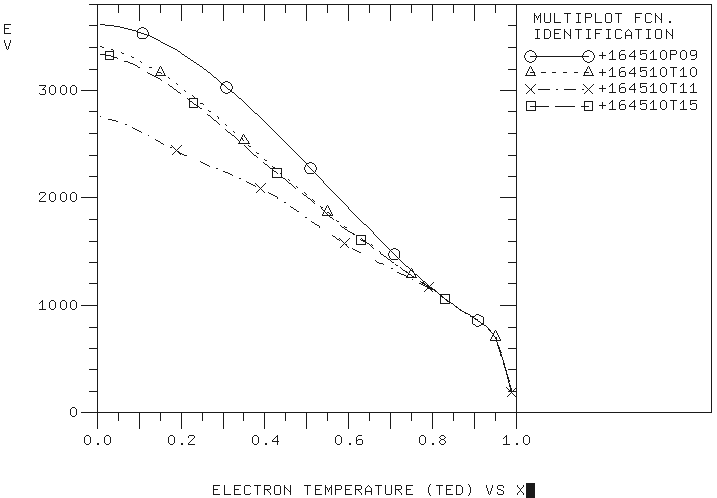
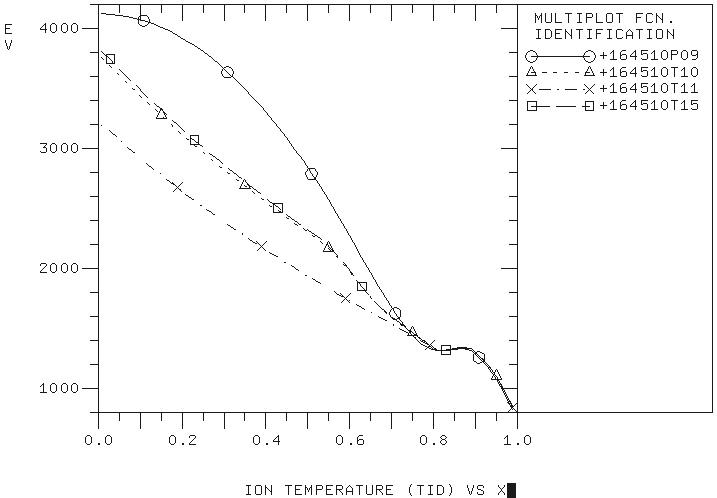
In order to test the effect of experimental density and q- profiles on the predicted temperature profiles, the U-files for density and q-profiles have been modified. In particular, in the simulation 164510T11 the q-profile from 3.5 sec to 5.1 sec is set to the experimental profile at 4.1 sec. In the simulation 164510T15, the q-profile from 3.5 sec to 5.01 sec is set to the experimental profile at 5.01 sec. In the first simulation, the agreement between experimental and predicted profile at 5.01 sec is examined. In the second simulation, the agreement at 4.1 sec is examined.
Use of the experimental q-profile at 5.01 as a constant profile from 3.5 sec to 5.1 sec, made the agreement with the experimental data better at 4.1 sec:
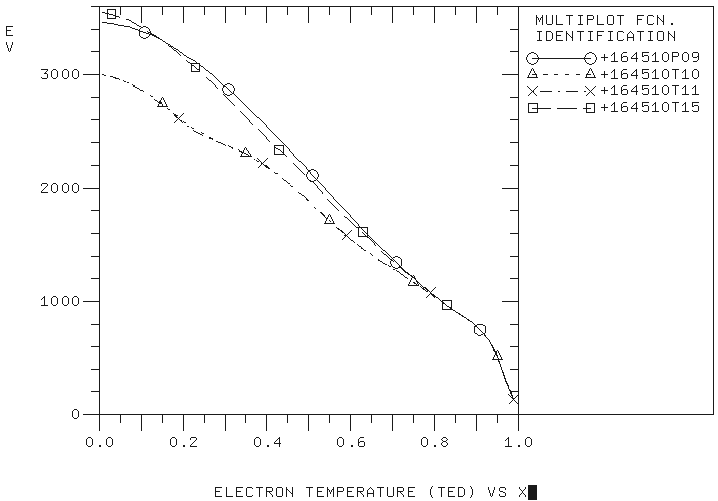
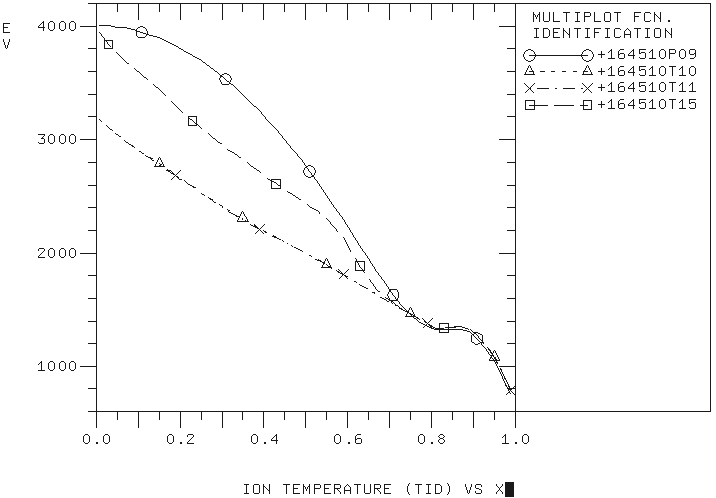
Use of the experimental q-profile at 4.1 as a constant profile from 3.5 sec to 5.01, made the agreement with the experimental data worth at 5.01 sec:
Similar study with the plasma density profiles (simulations 164510T12 and 164510T14) show a relatively weak dependence on the plasma density profiles.
Leave a Reply