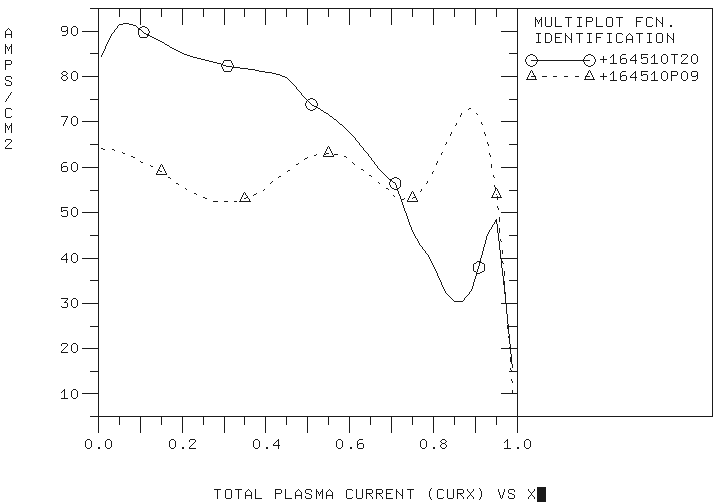
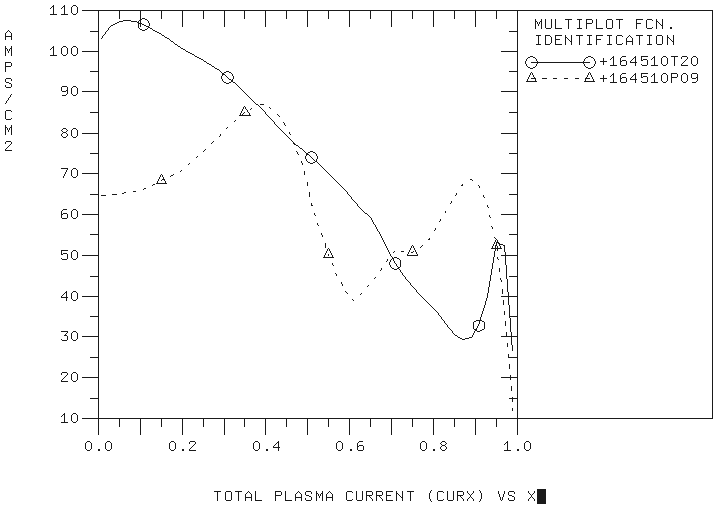
In the simulation 164510T20, the plasma current is evolved and q-profiles are recomputed. The TEQ module is used to evolve the equilibrium. At both times of interest, the plasma current is redistributed to produce higher plasma current densities in the plasma core and lower plasma densities at the plasma edge:
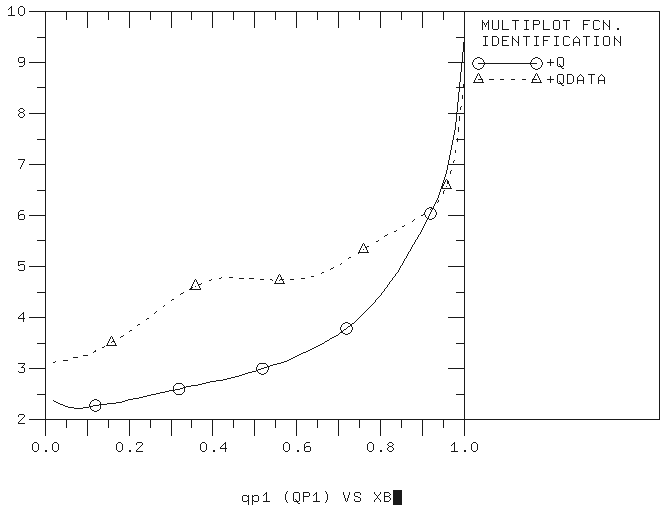
The predicted q-profiles are lower in the plasma core and smoother comparing to the experimental profiles. The differences in the q-profiles are especially large at 4.1 sec:
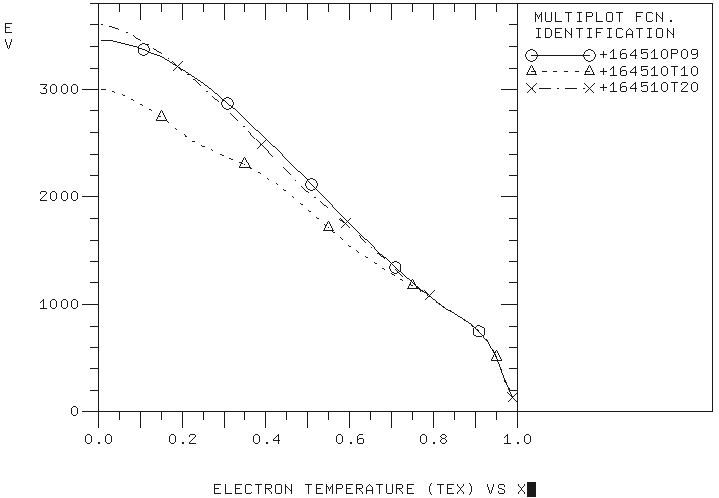
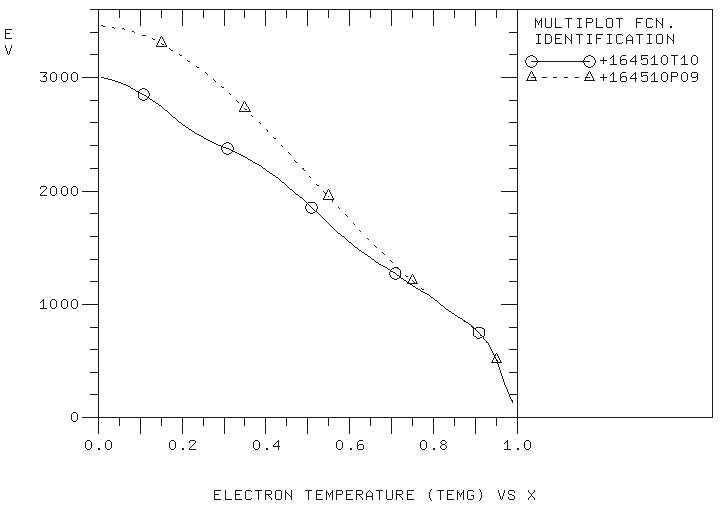
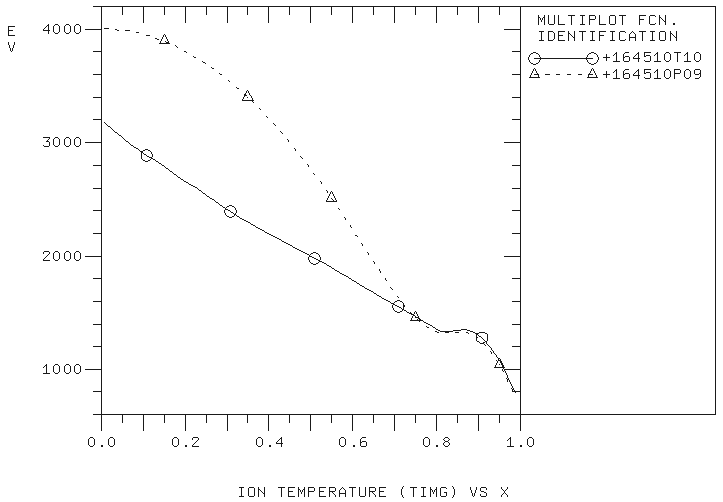
The agreement with the experimental data has significantly improved at 4.1 sec:
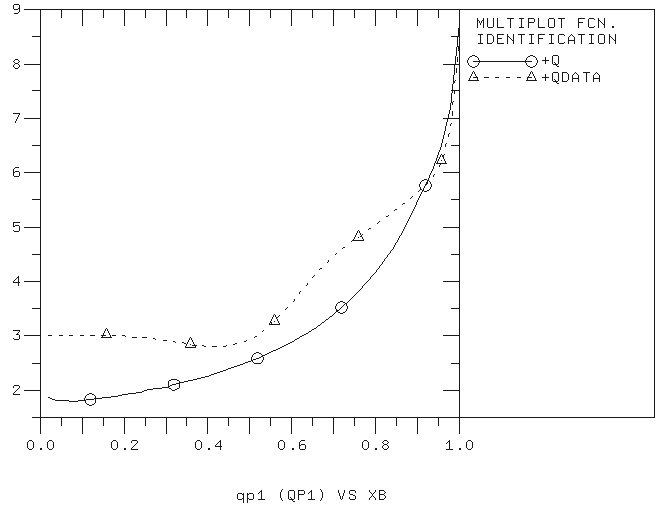
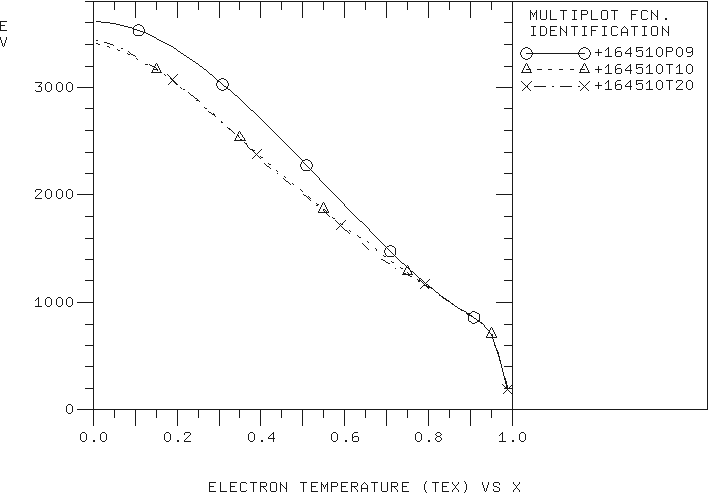
and almost did not change at 5.01 sec:
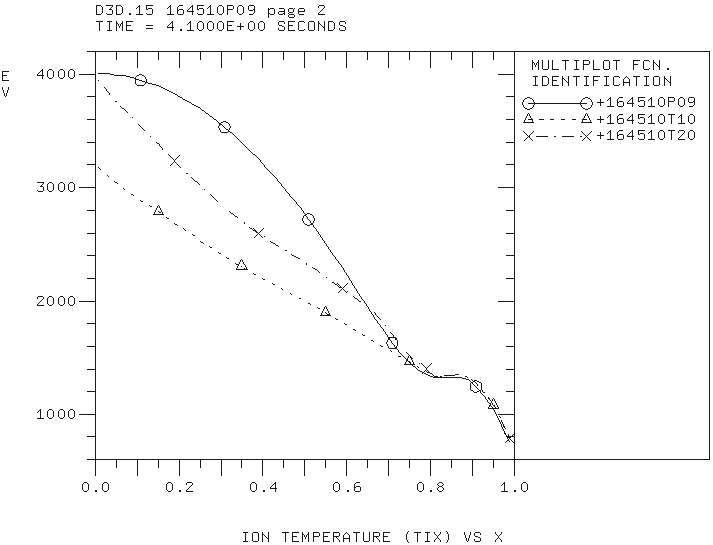
The MMM7.1 module still over-predict the ITG transport in the plasma core.
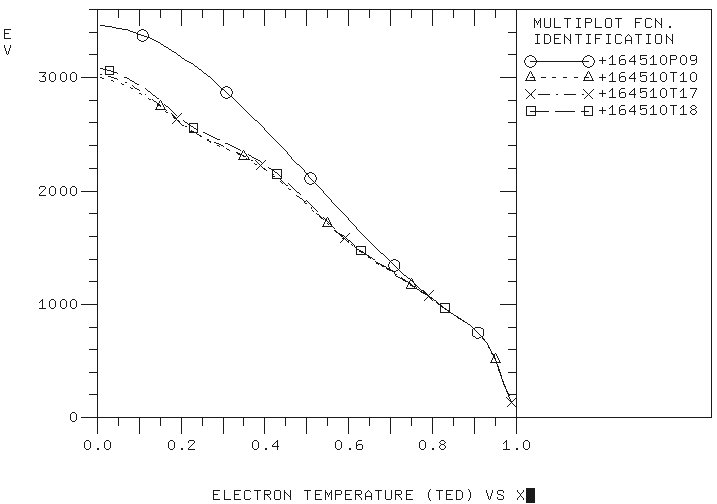
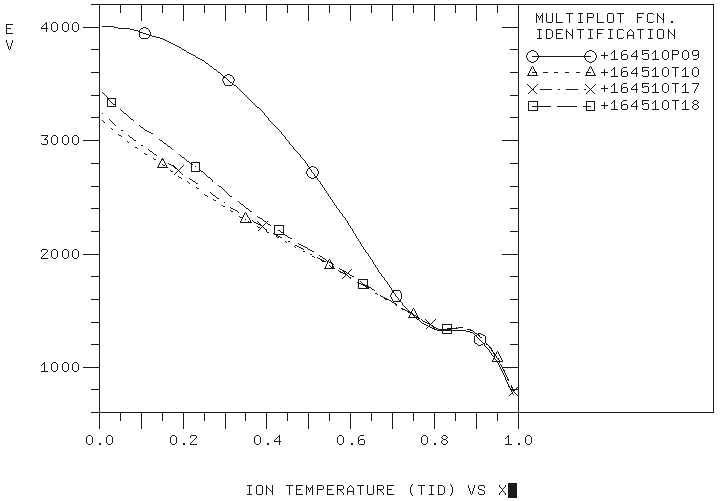
The effect of ExB is investigated by scaling the ExB flow shear rates. In the simulations results presented below, the ExB flow shear rate is scaled by the factor of 2 (164510T17) and by the factor of 5 (164510T18). Very small effect on both electron and ion temperatures is found at the first time of interest:
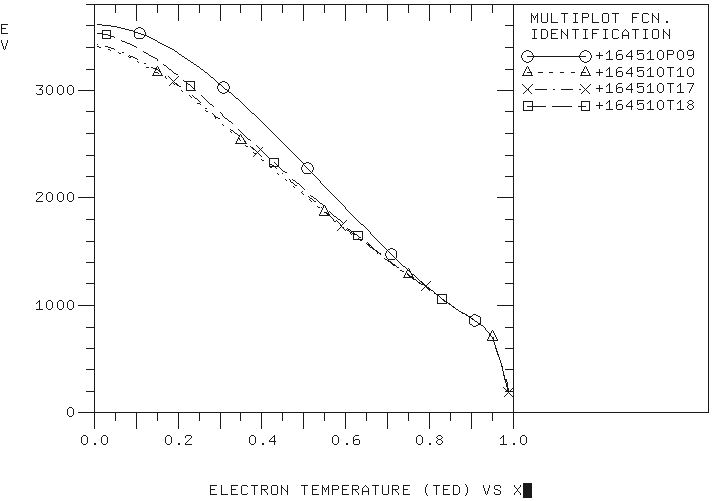
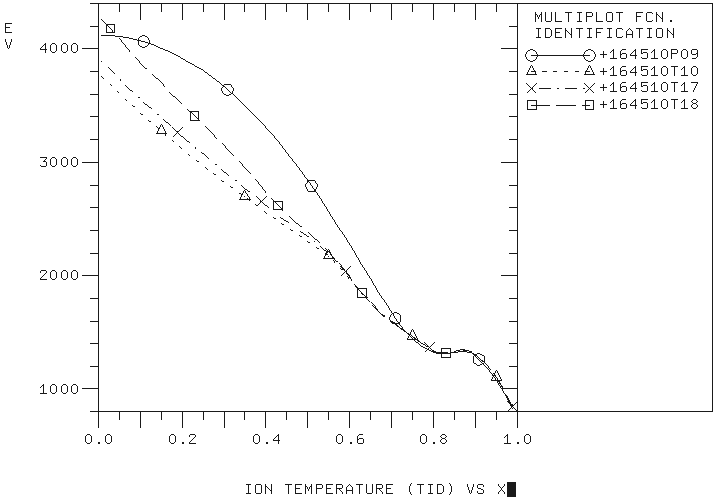
The ion temperature is affected somewhat more at later time when the ExB flow shear is increased by the factor of 5:
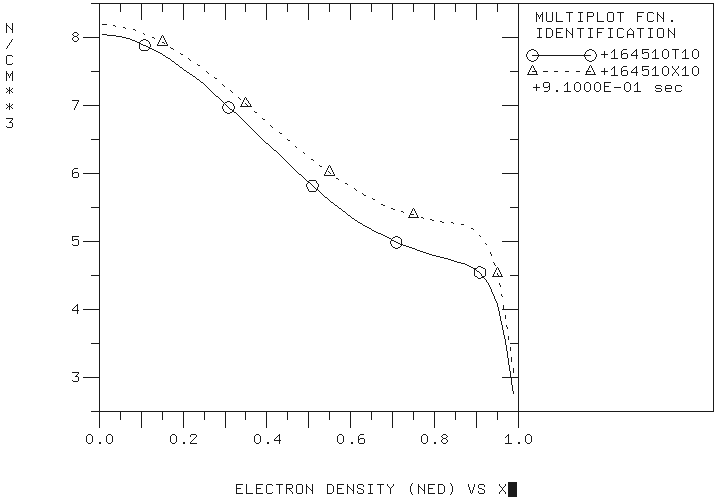
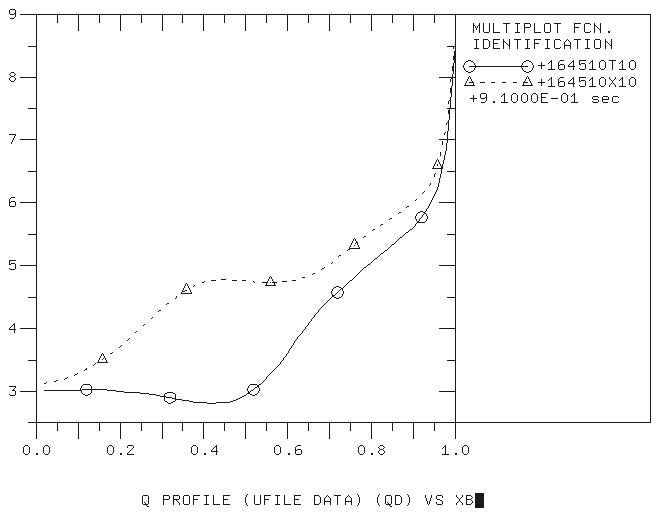
The density profiles and the plasma equilibrium are not evolved in our TRANSP simulations of the DIII-D discharge 164410. Any experimental uncertainties for these two quantities can affect the predicted electron and ion temperature profiles. The experimental q and ne profiles at the times of interest are given below.
The electron density profiles at 4.1 sec (dashed curve) and 5.01 sec (solid curve).
The q profiles at 4.1 sec (dashed curve) and 5.01 sec (solid curve).
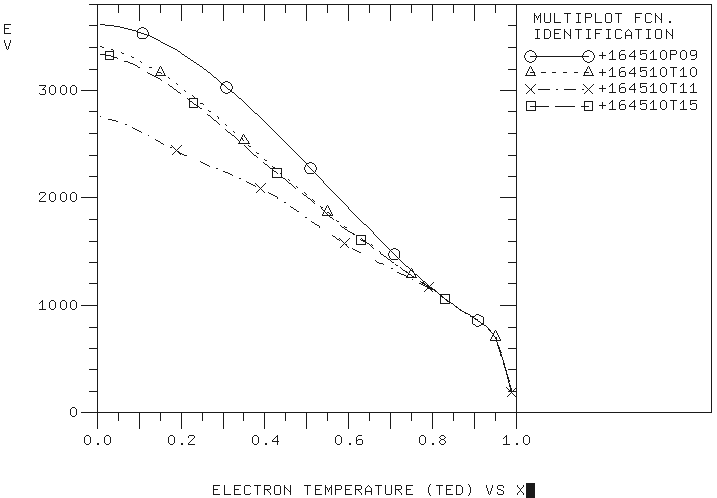
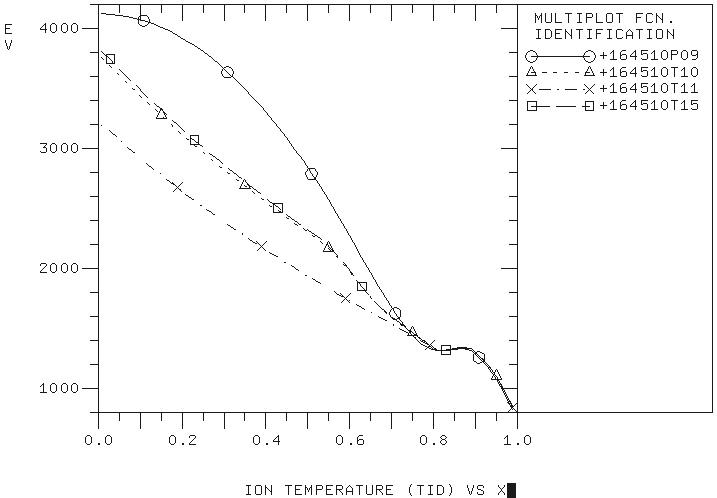
In order to test the effect of experimental density and q- profiles on the predicted temperature profiles, the U-files for density and q-profiles have been modified. In particular, in the simulation 164510T11 the q-profile from 3.5 sec to 5.1 sec is set to the experimental profile at 4.1 sec. In the simulation 164510T15, the q-profile from 3.5 sec to 5.01 sec is set to the experimental profile at 5.01 sec. In the first simulation, the agreement between experimental and predicted profile at 5.01 sec is examined. In the second simulation, the agreement at 4.1 sec is examined.
Use of the experimental q-profile at 5.01 as a constant profile from 3.5 sec to 5.1 sec, made the agreement with the experimental data better at 4.1 sec:
Use of the experimental q-profile at 4.1 as a constant profile from 3.5 sec to 5.01, made the agreement with the experimental data worth at 5.01 sec:
Similar study with the plasma density profiles (simulations 164510T12 and 164510T14) show a relatively weak dependence on the plasma density profiles.
The DIII-D discharge 164510 is a high plasma current discharge with two times of interest at t=4.1 sec with the plasma current 0.9 MA and at t=5.01 sec with the plasma current 1.05 MA.
The MMM7.1 model in the TRANSP code has been used to model this discharge. At both times, the electron and ion temperatures are found to be under-predicted. The MMM7.1 has also failed to reproduce the internal transport barrier observed in the ion channel of transport.
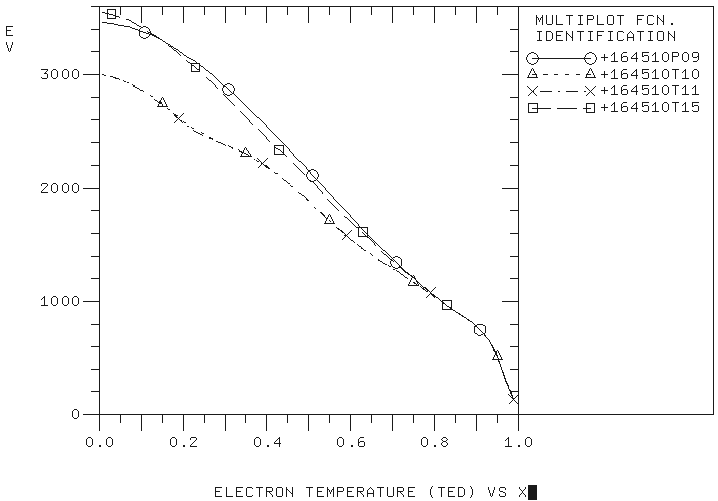
The electron temperature profile at 4.1 sec predicted with the MMM7.1 model (solid curve) and experimental profile (dashed curve).
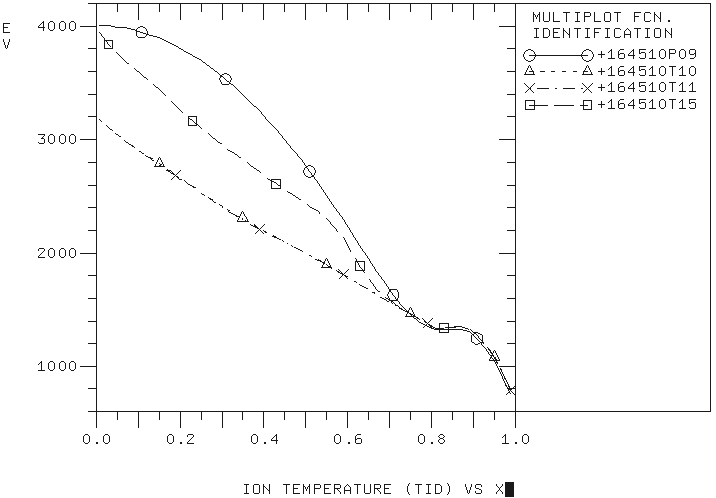
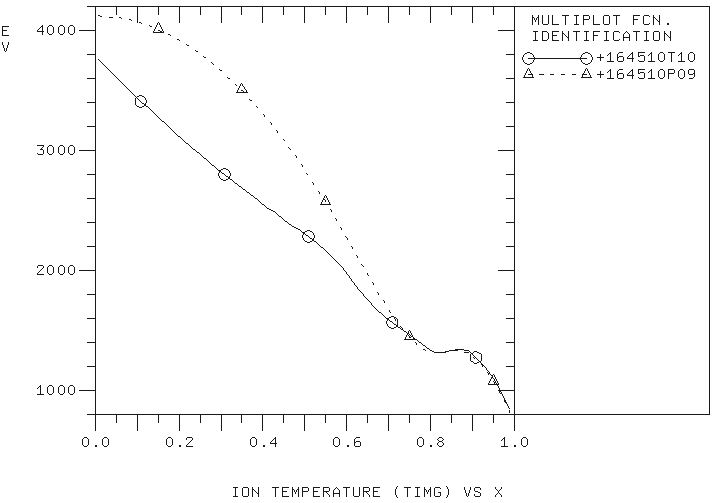
The ion temperature profile at 4.1 sec predicted with the MMM7.1 model (solid curve) and experimental profile (dashed curve).
The electron temperature profile at 5.01 sec predicted with the MMM7.1 model (solid curve) and experimental profile (dashed curve)
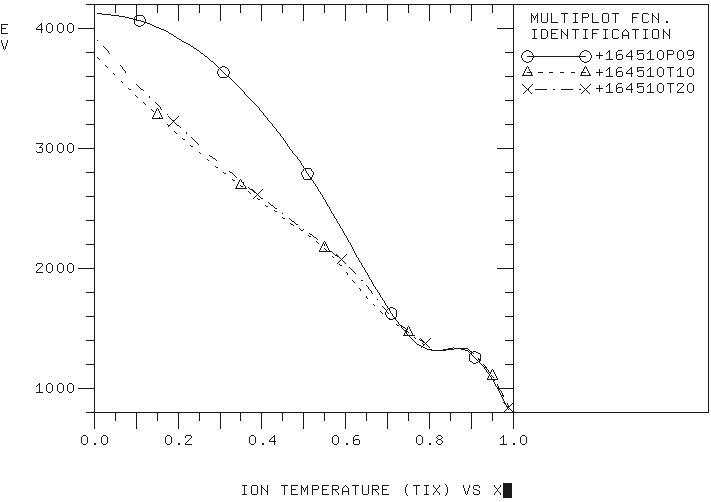
The ion temperature profile at 5.01 sec predicted with the MMM7.1 model (solid curve) and experimental profile (dashed curve).
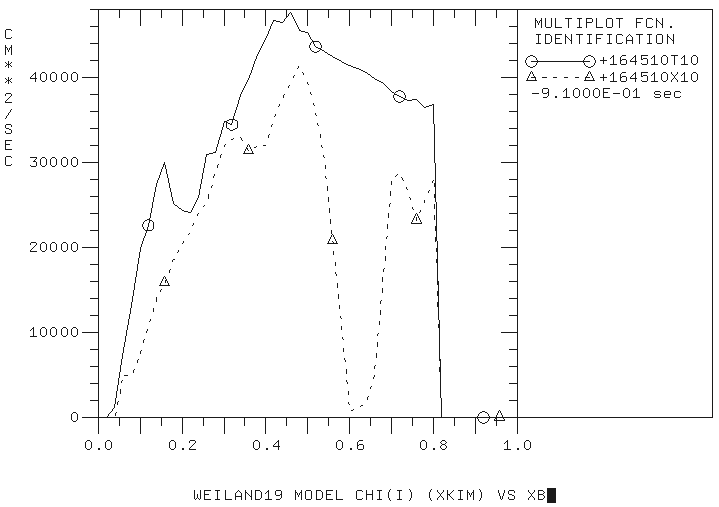
There is a strong ion thermal transport driven by ion temperature gradient modes at both times of interest:
Ion thermal diffusivities at 4.1 sec (solid curve) and 5.01 sec (dashed curve).
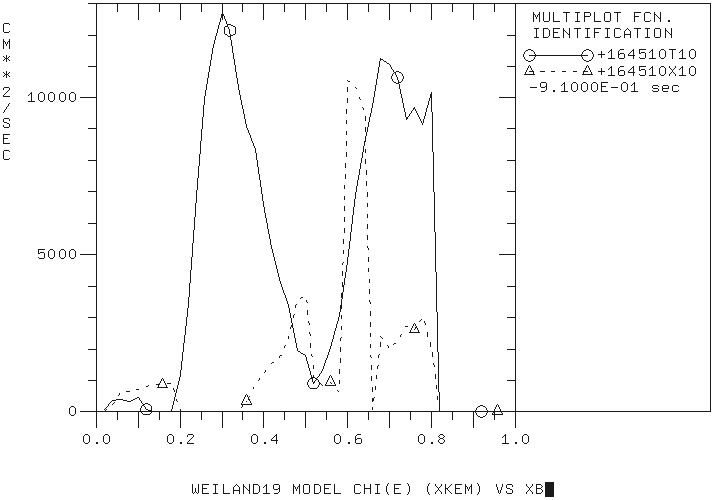
The electron thermal transport is smaller than the ion thermal transport.
Electron thermal diffusivities from Weiland component of MMM7.1 at 4.1 sec (solid curve) and 5.01 sec (dashed curve).
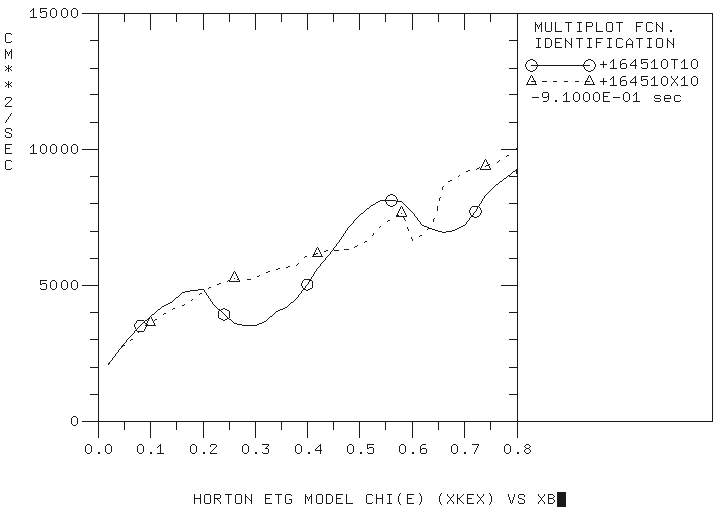
The contribution from the ETG component is also relatively small and does not change much between two times of interest.
Electron thermal diffusivities from the ETG component at 4.1 sec (solid curve) and 5.01 sec (dashed curve).
It is likely that the model over-predict the ion thermal transport driven by ITG modes in this plasma parameter regime.
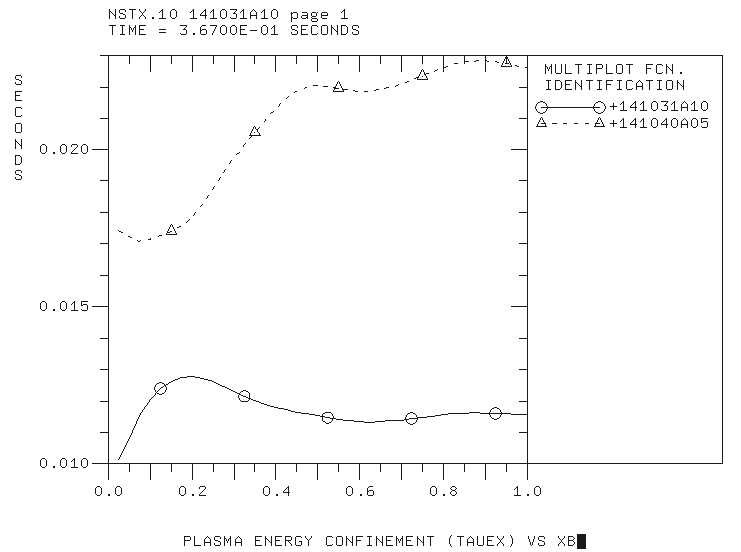
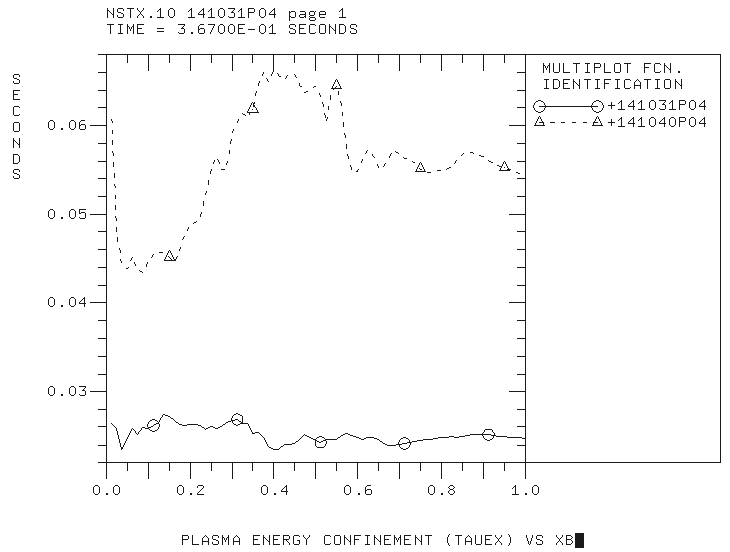
The MMM8.1 model in TRANSP reproduces the experimental dependence of the energy confinement times on the plasma collisionality. However, the values of the predicted confinement times are systematically larger than the confinement times derived from experiments. Most likely reason is missing transport from modes that are not part of MMM8.1 such as microtearing modes.
Experimental energy confinement times
Predicted energy confinement times
Plasma collisionality scan using standalone MMM8.1 model revealed that most components in MMM8.1 can not explain the dependence that is observed in predicted TRANSP simulations and in experiment. The Weiland component that computes fluxes associated with most drift-wave instabilities such as ITG modes in the plasma core shows that the electron and ion thermal diffusivities are stabilized by the plasma collisionality. This effect is expected because of known dumping effect of plasma collisionality on the drift-wave modes. There are two possible explanations of the discrepancies between predictive and standalone MMM8.1 runs.
In experimental plasma collisionality scans, it is very difficult to keep all dimensionless parameters unchanged. In particular, it is difficult to maintain the plasma current distribution unchanged when the plasma density changes. As result, there are notable differences in the safety factor profiles between two discharges. When the q and magnetic shear from one discharge is used in standalone runs for the other discharge, the expected dependence is partially recovered. The differences between safety factor and magnetic shear profiles can not completely explain the differences in the dependencies in the predictive and standalone runs, but these differences in the experimental profiles make contribution in the right direction.
There are modes in that DRIBM model in MMM8.1 that becomes more unstable with the resistivity. These modes are difficult to separate from other MHD modes that are described by DRIBM. However, our previous studies for DIII-D clearly show the expected dependence:
The dependence of electron thermal diffusivity on the collision frequency for DIII-D
The resistive mode in DRIBM that is found to be destabilized with the plasma collisionality is typically has large contribution in the plasma edge region near the separatrix. Note that the paleoclassical model that is distributed together with the MMM8.1 model is expected to have a similar dependence on the resistivity. However, the paleoclasical model is still being validated. Usually, it is not used in the predictive runs with the MMM8.1 model.
The predictive simulations with the MMM8.1 model show the same trend as observed in experiments. The confinement times for the low plasma collisionality discharge are larger. However, the values of confinement time are systematically higher comparing to the confinement times derived from the experimental data. Most likely reason is missing transport from instabilities that are not part of MMM8.1 (such as microtearing modes).
It is found that the safety factor q profile and the magnetic shear s profile can change the dependence. When the q and s profiles for the NSTX discharge 141031 are replaced with the corresponding profiles for the discharge 141040, the experimental dependence is partially recovered. The electron thermal diffusivity profiles on the figure below that is marked as hybrid31c is generated using the Weiland model in MMM8.1 with the plasma profiles for the discharge 141031 with the exception of the q and s profiles that are taken from the discharge 141040.
In order keep the plasma equilibrium unchanged, the density and temperature profiles should be changed with a scaling factor :
where the indices , and stand for electrons, ions, impurities and fast particles correspondingly. The plasma pressure, , normalized gradients and scale lengths as well as ratio of the electron to ion temperatures will remain unchanged.
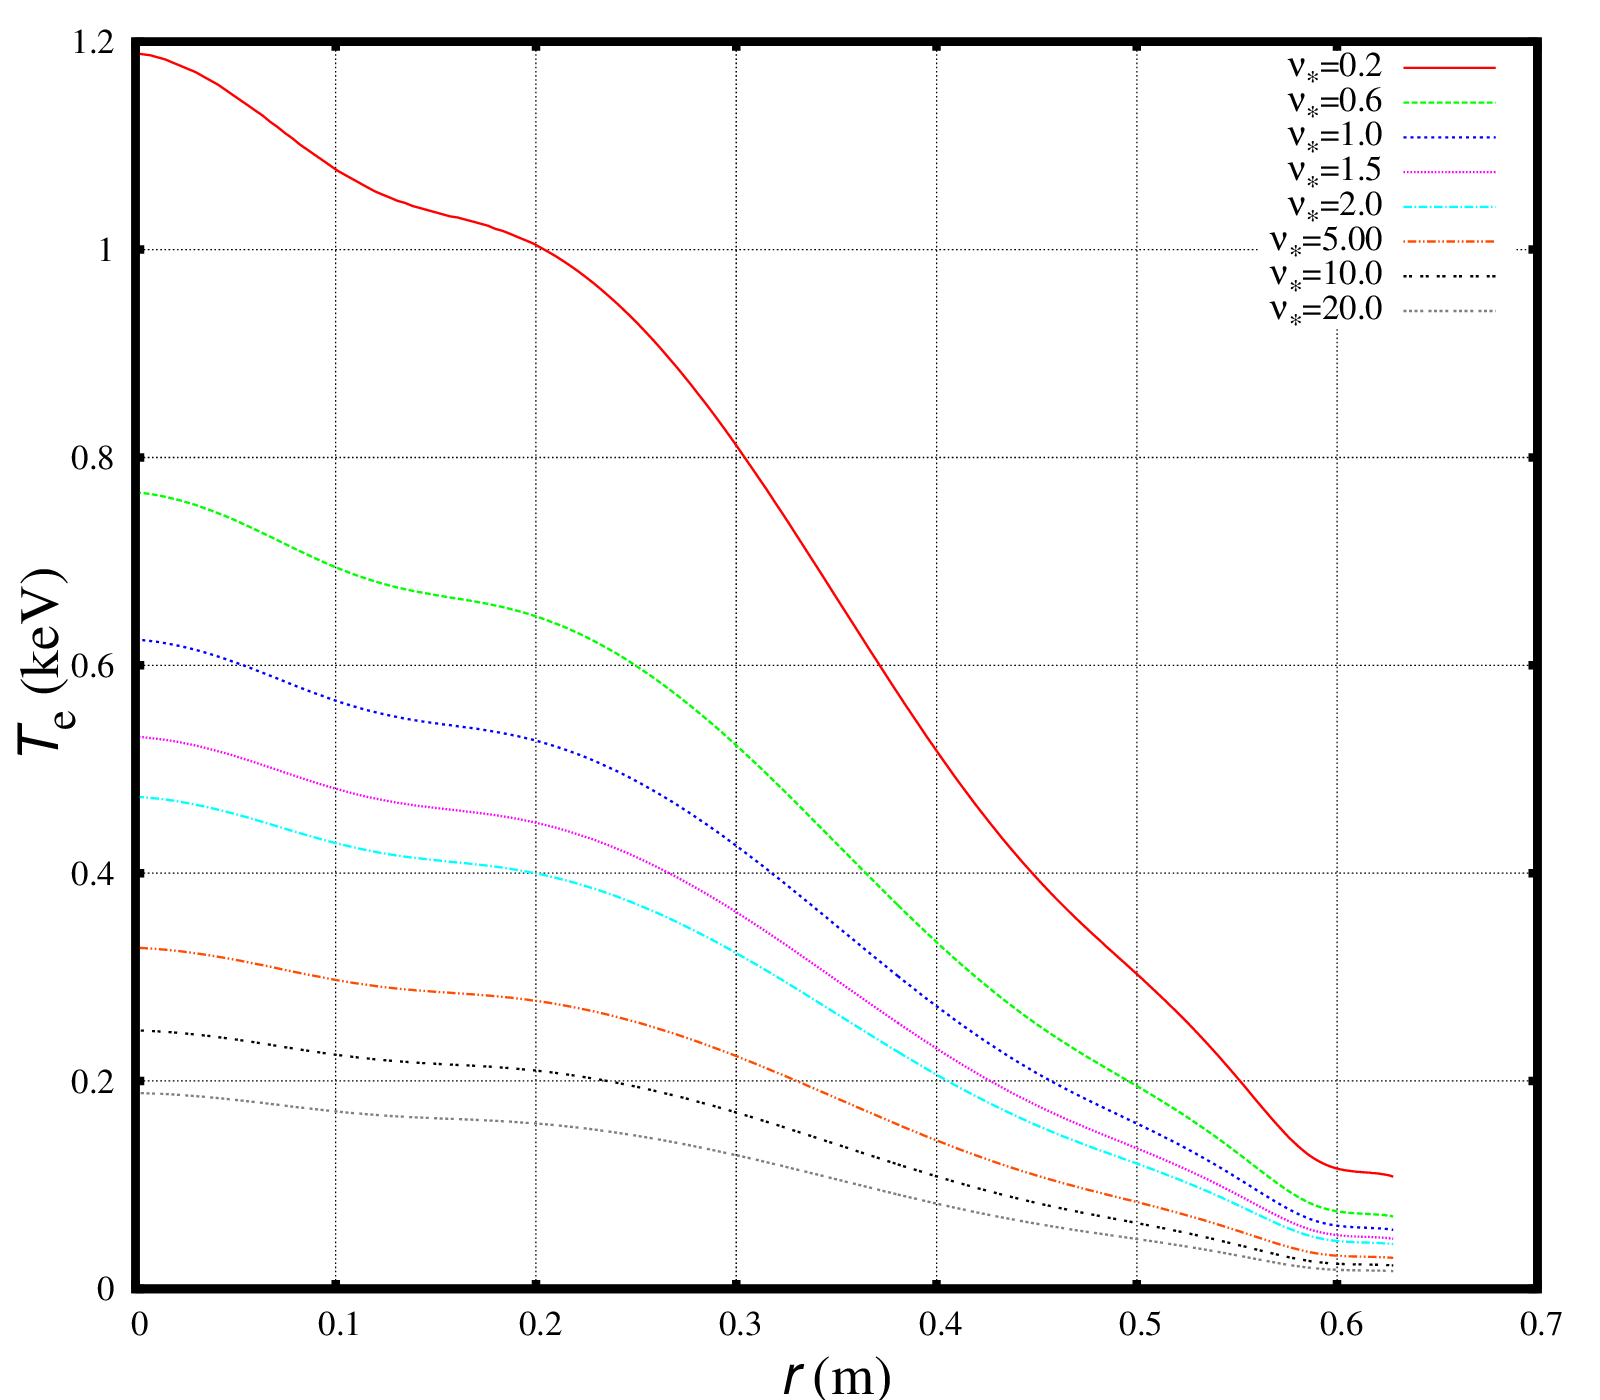
The plasma collisionality for the NSTX discharge 141031 is varied from 0.2 to 20 from the original plasma collisionality. The density and temperature profiles in these scans are shown below:
The electron density profiles for different collisionalities
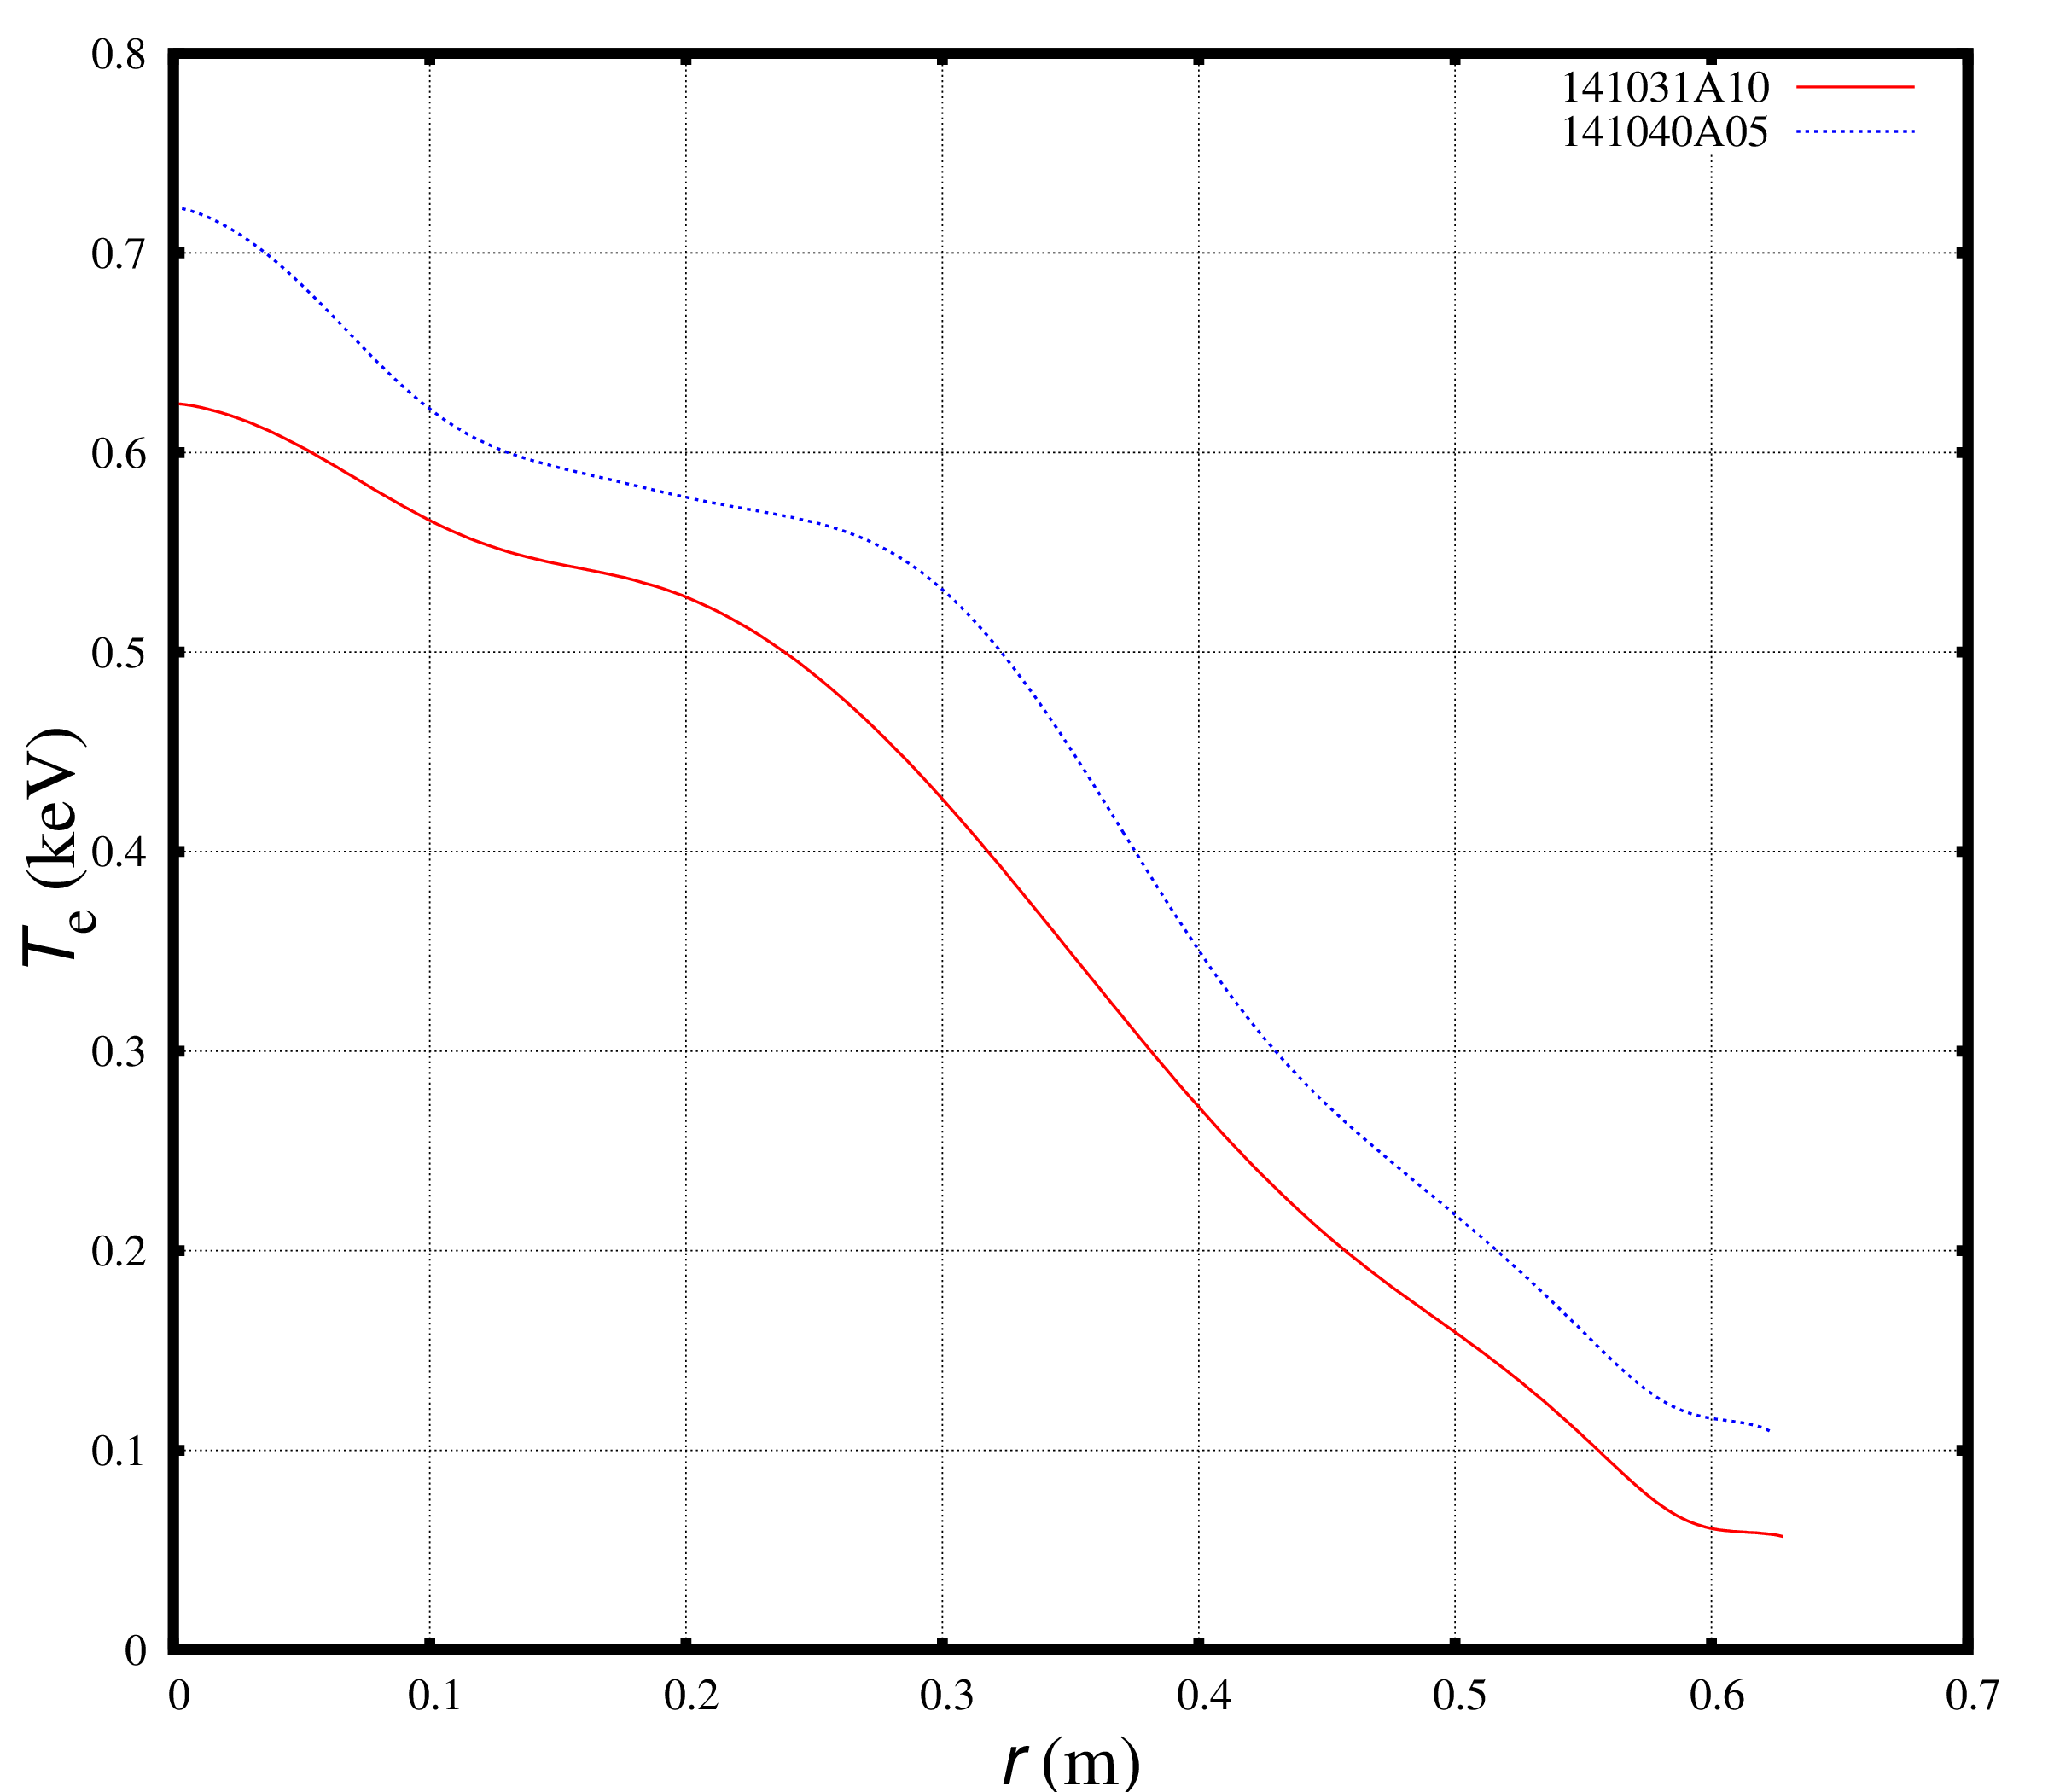
The electron temperature profiles for different collisionalities
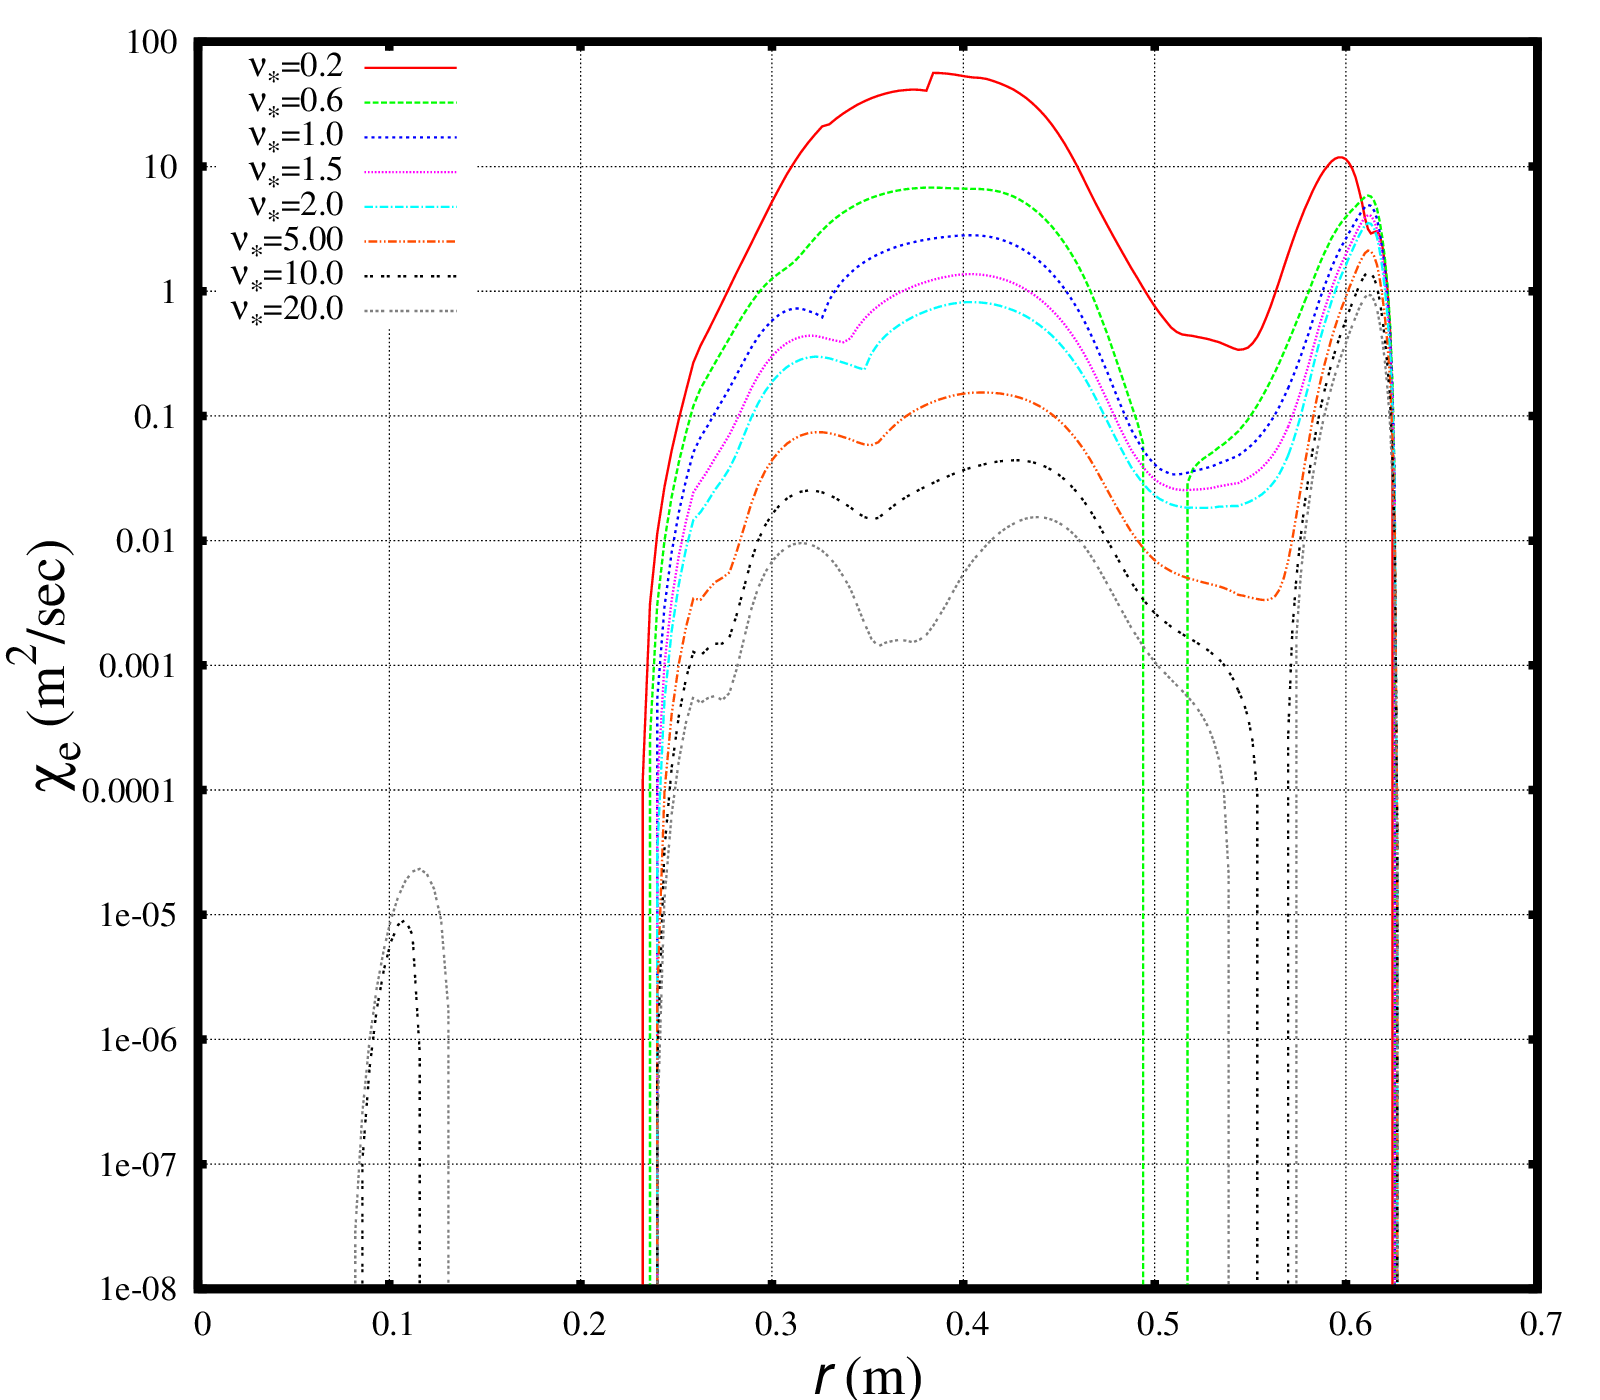
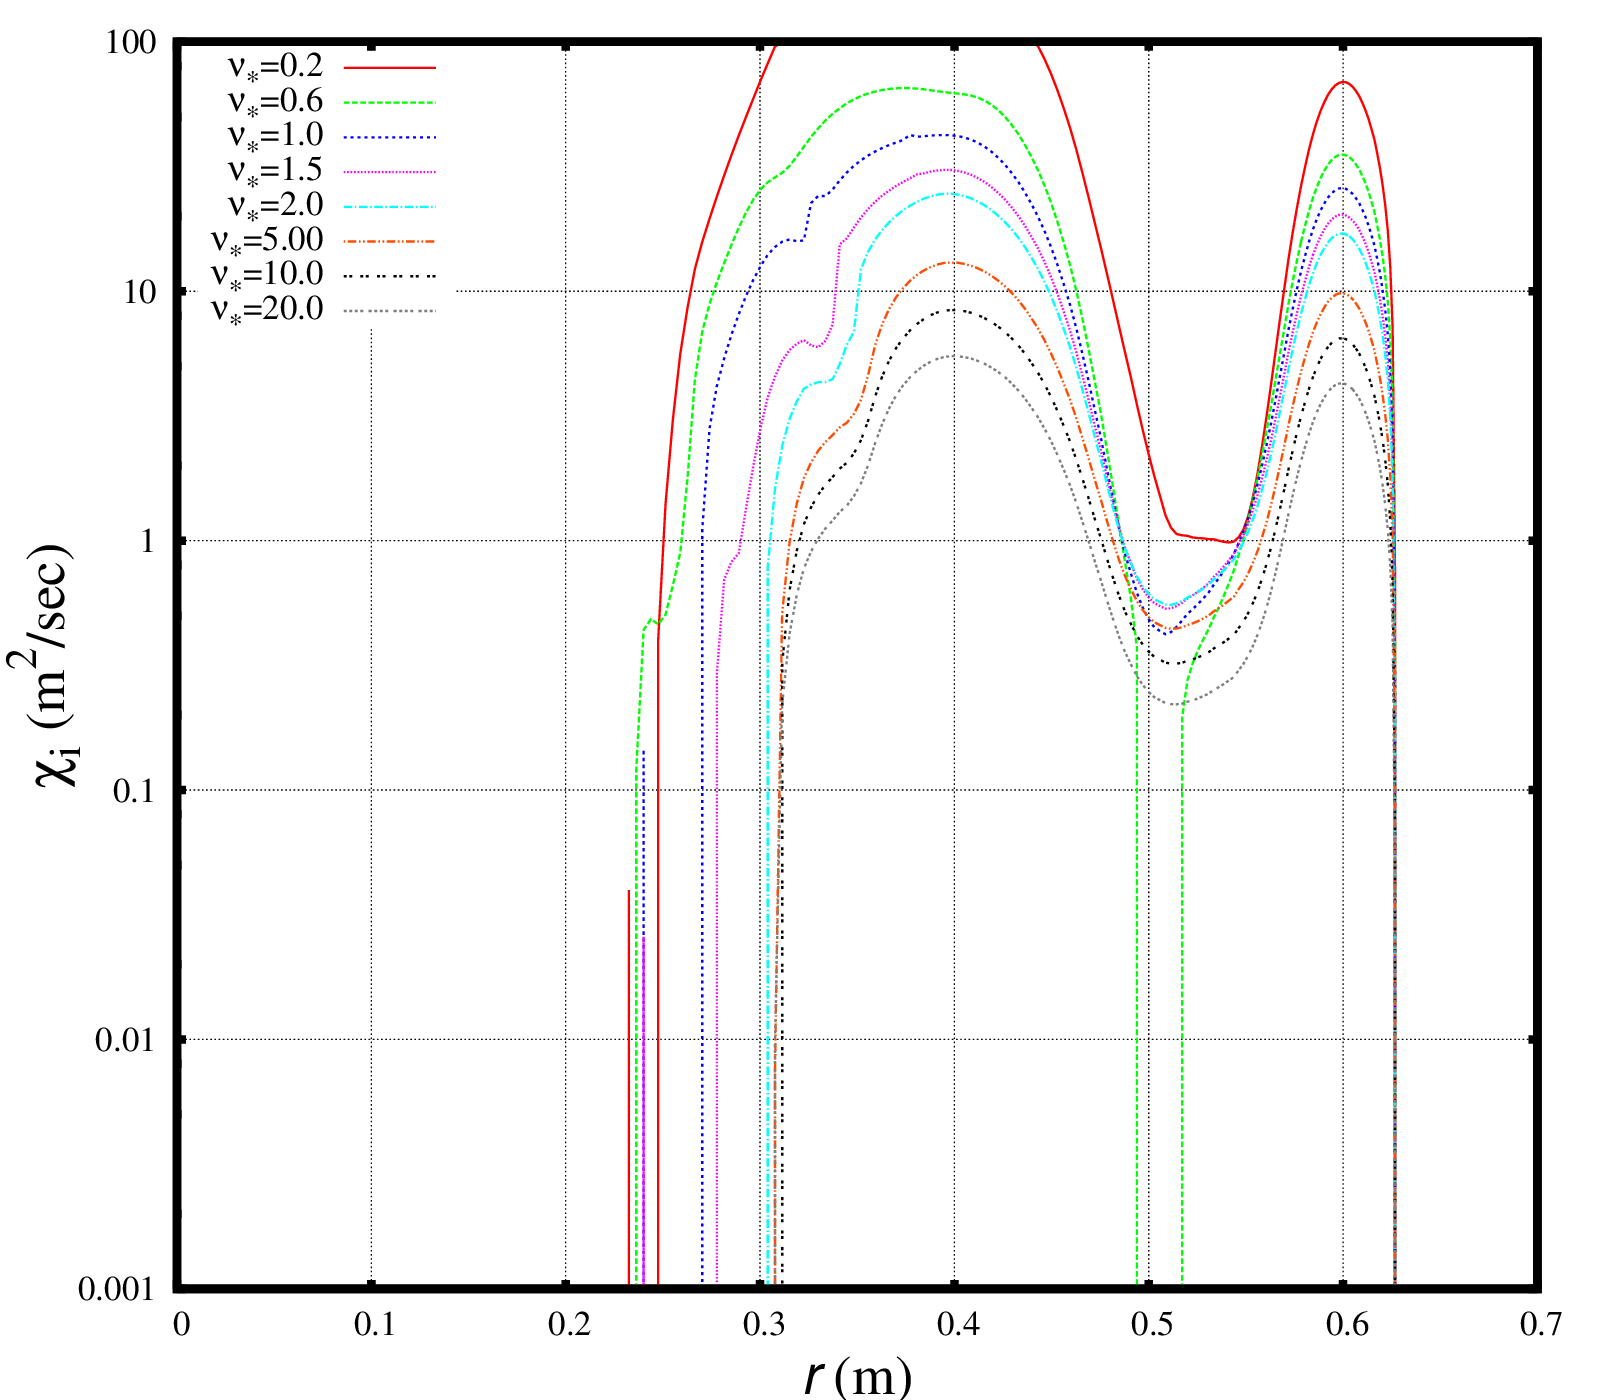
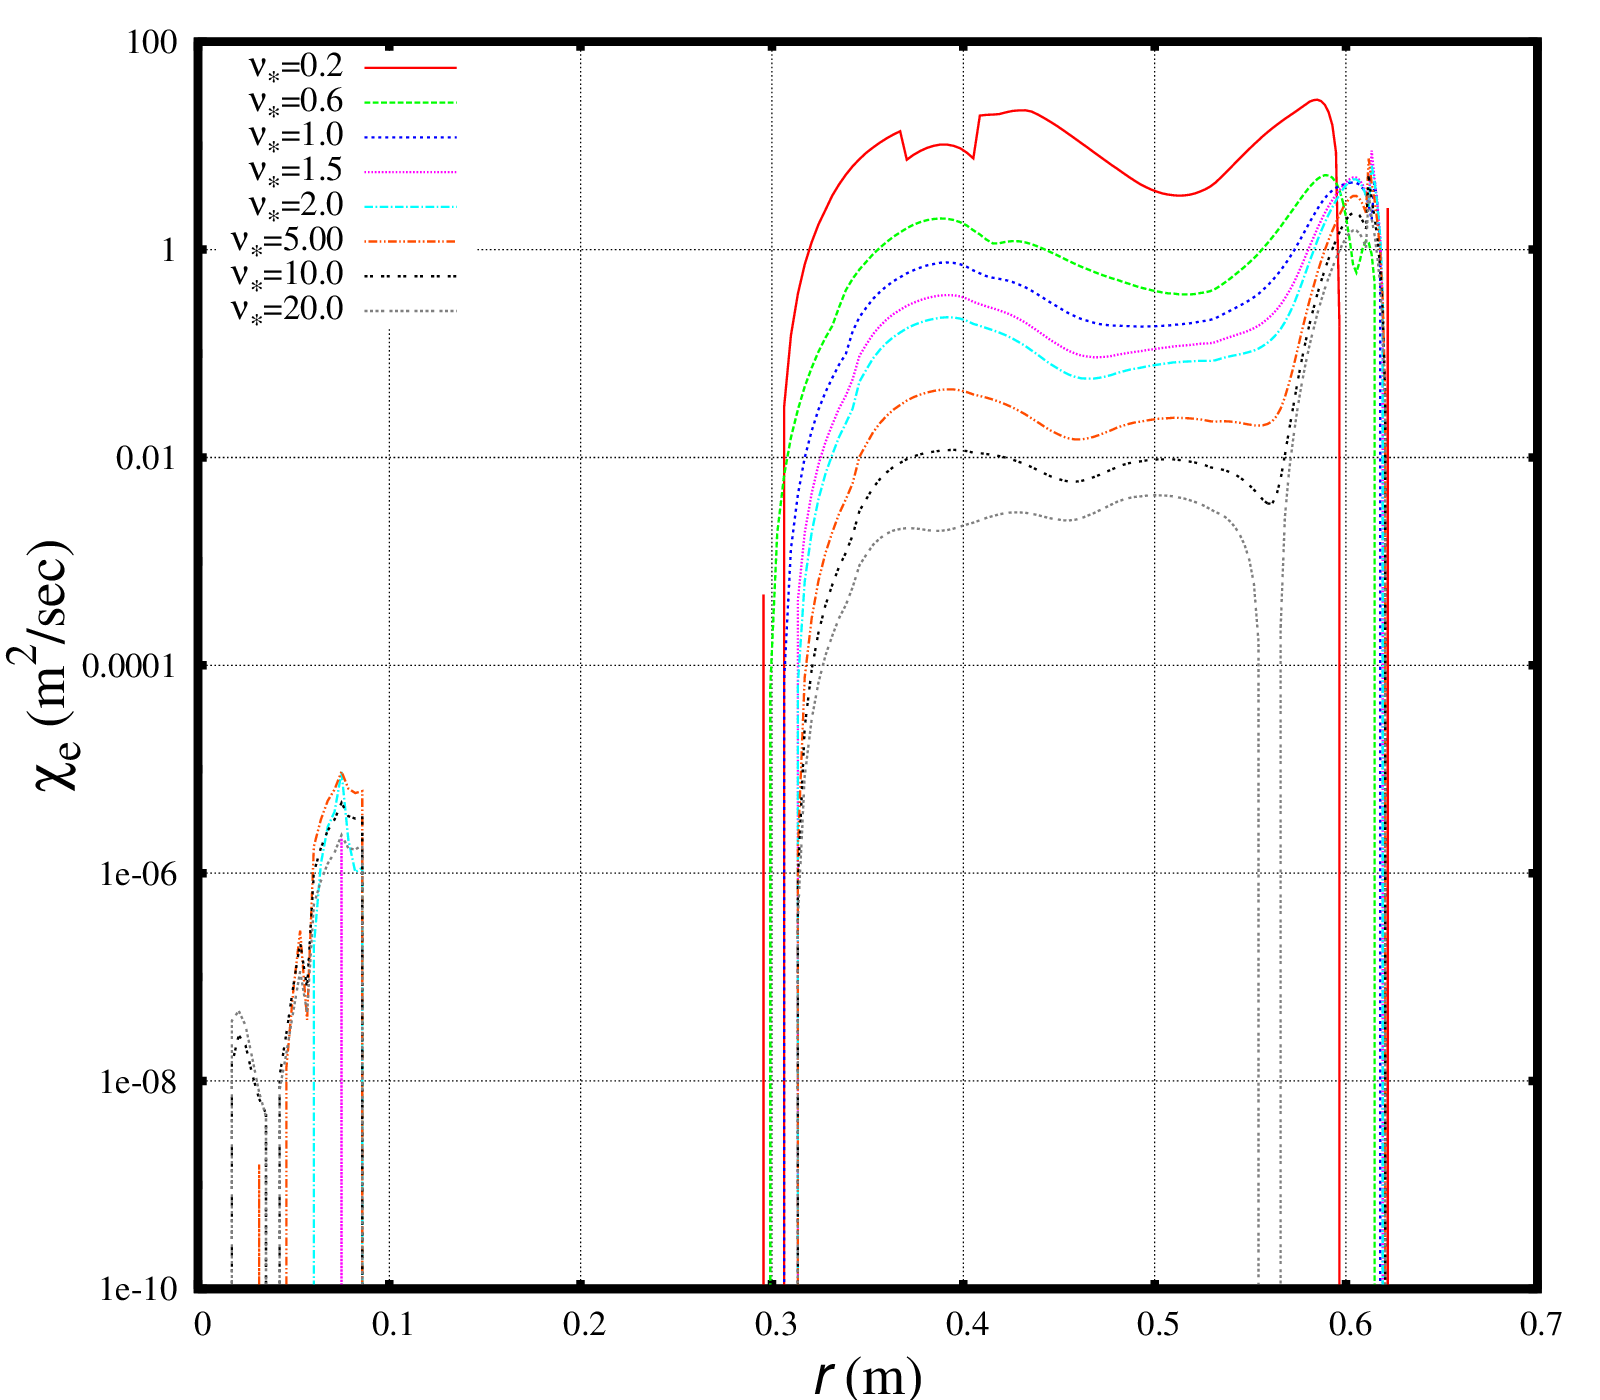
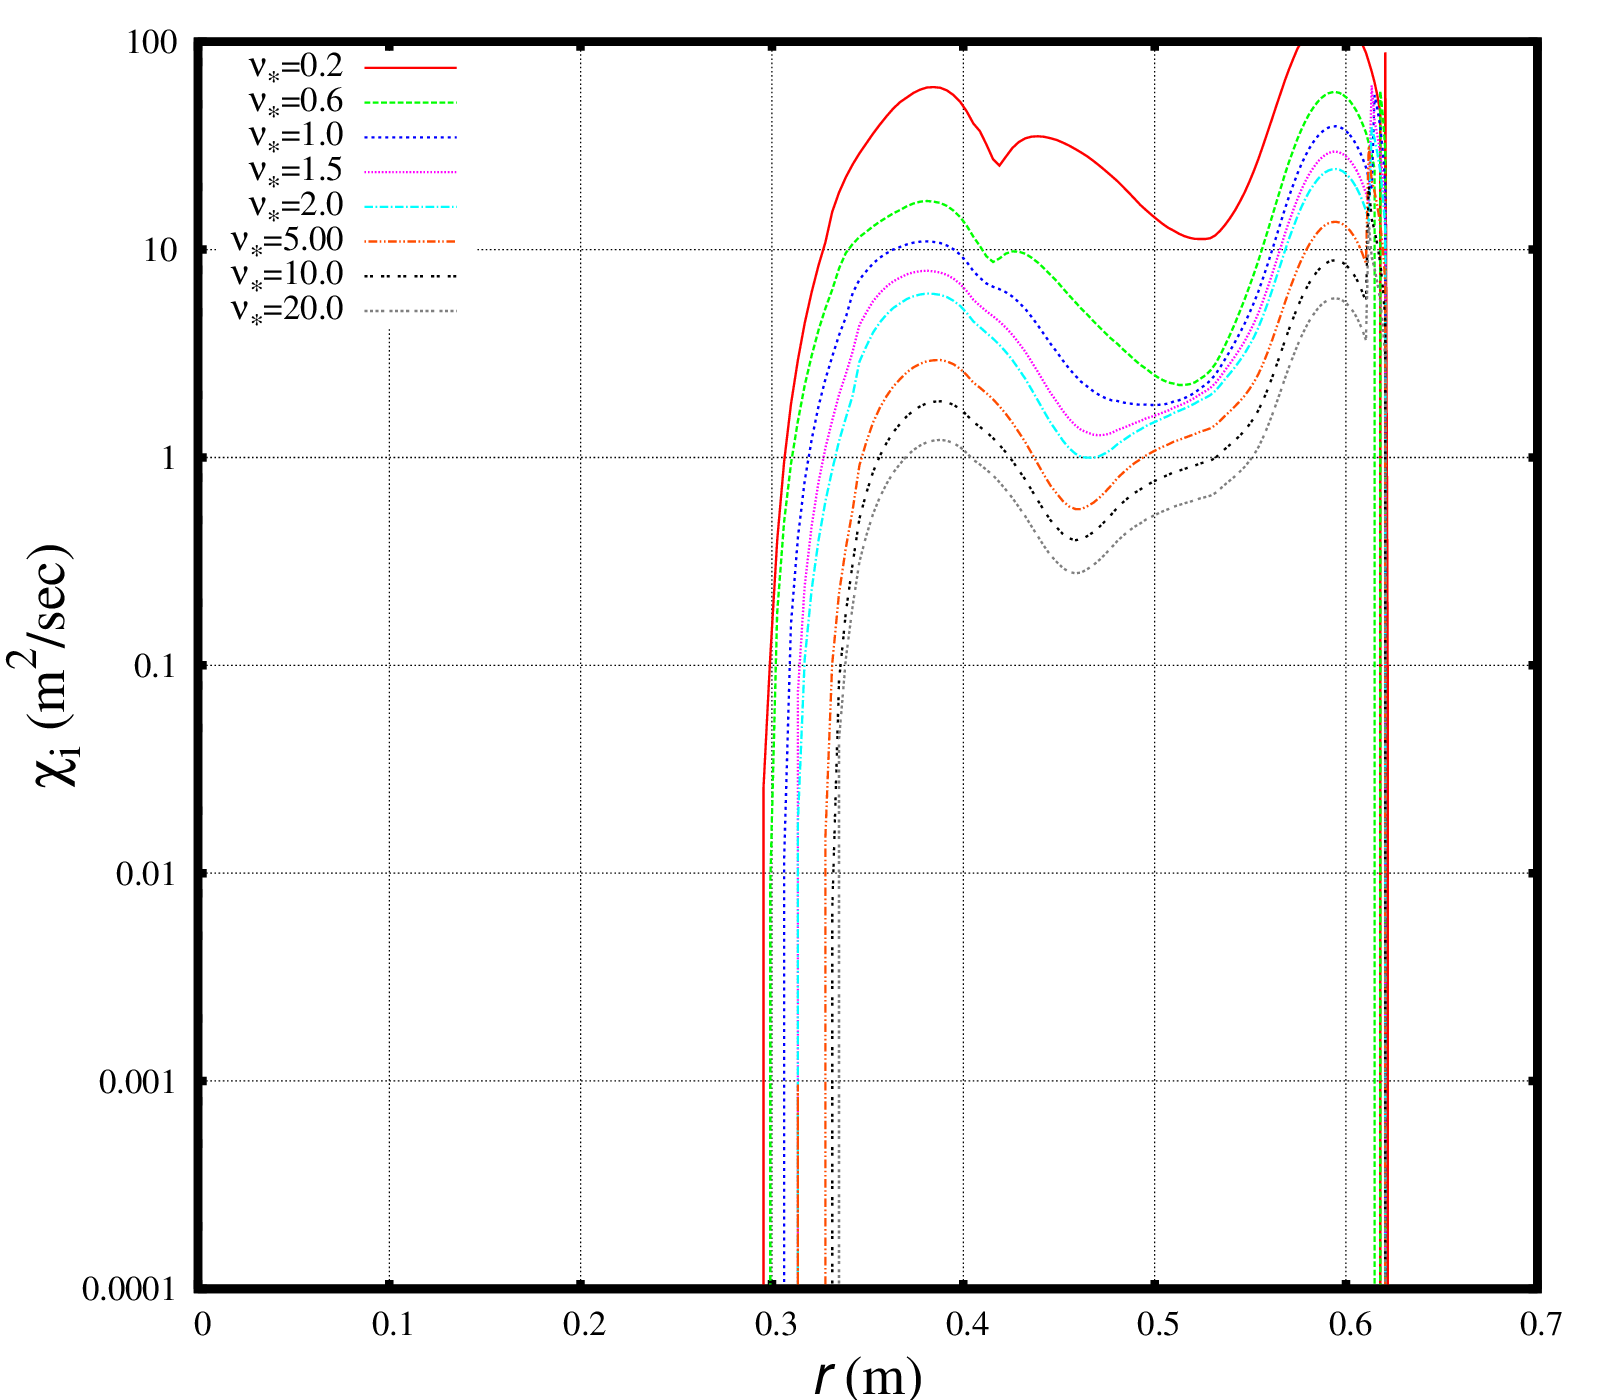
It has been found that increased collisionality results in smaller values of anomalous diffusivities computed with the Weiland model in MMM8.1:
Electron thermal diffusivities
Ion thermal diffusivities
The diffusivity is monotonically decreases with the collisionality. The results for the NSTX discharge 141040 are similar:
Electron thermal diffusivity
Ion thermal diffusivity
When used standalone, the Weiland model in MMM8.1 can not explain the experimental trend . However, when used in the whole device integrated modeling code, the MMM8.1 model can reproduce the experimental profiles and trend reasonably well. The main remaining question is what are the changes in other profiles (e.g., safety factor and magnetic shear) can change the dependence.
The NSTX discharges 141031 and 141040 have comparable density profiles, but their temperature profiles are distinguishably different:
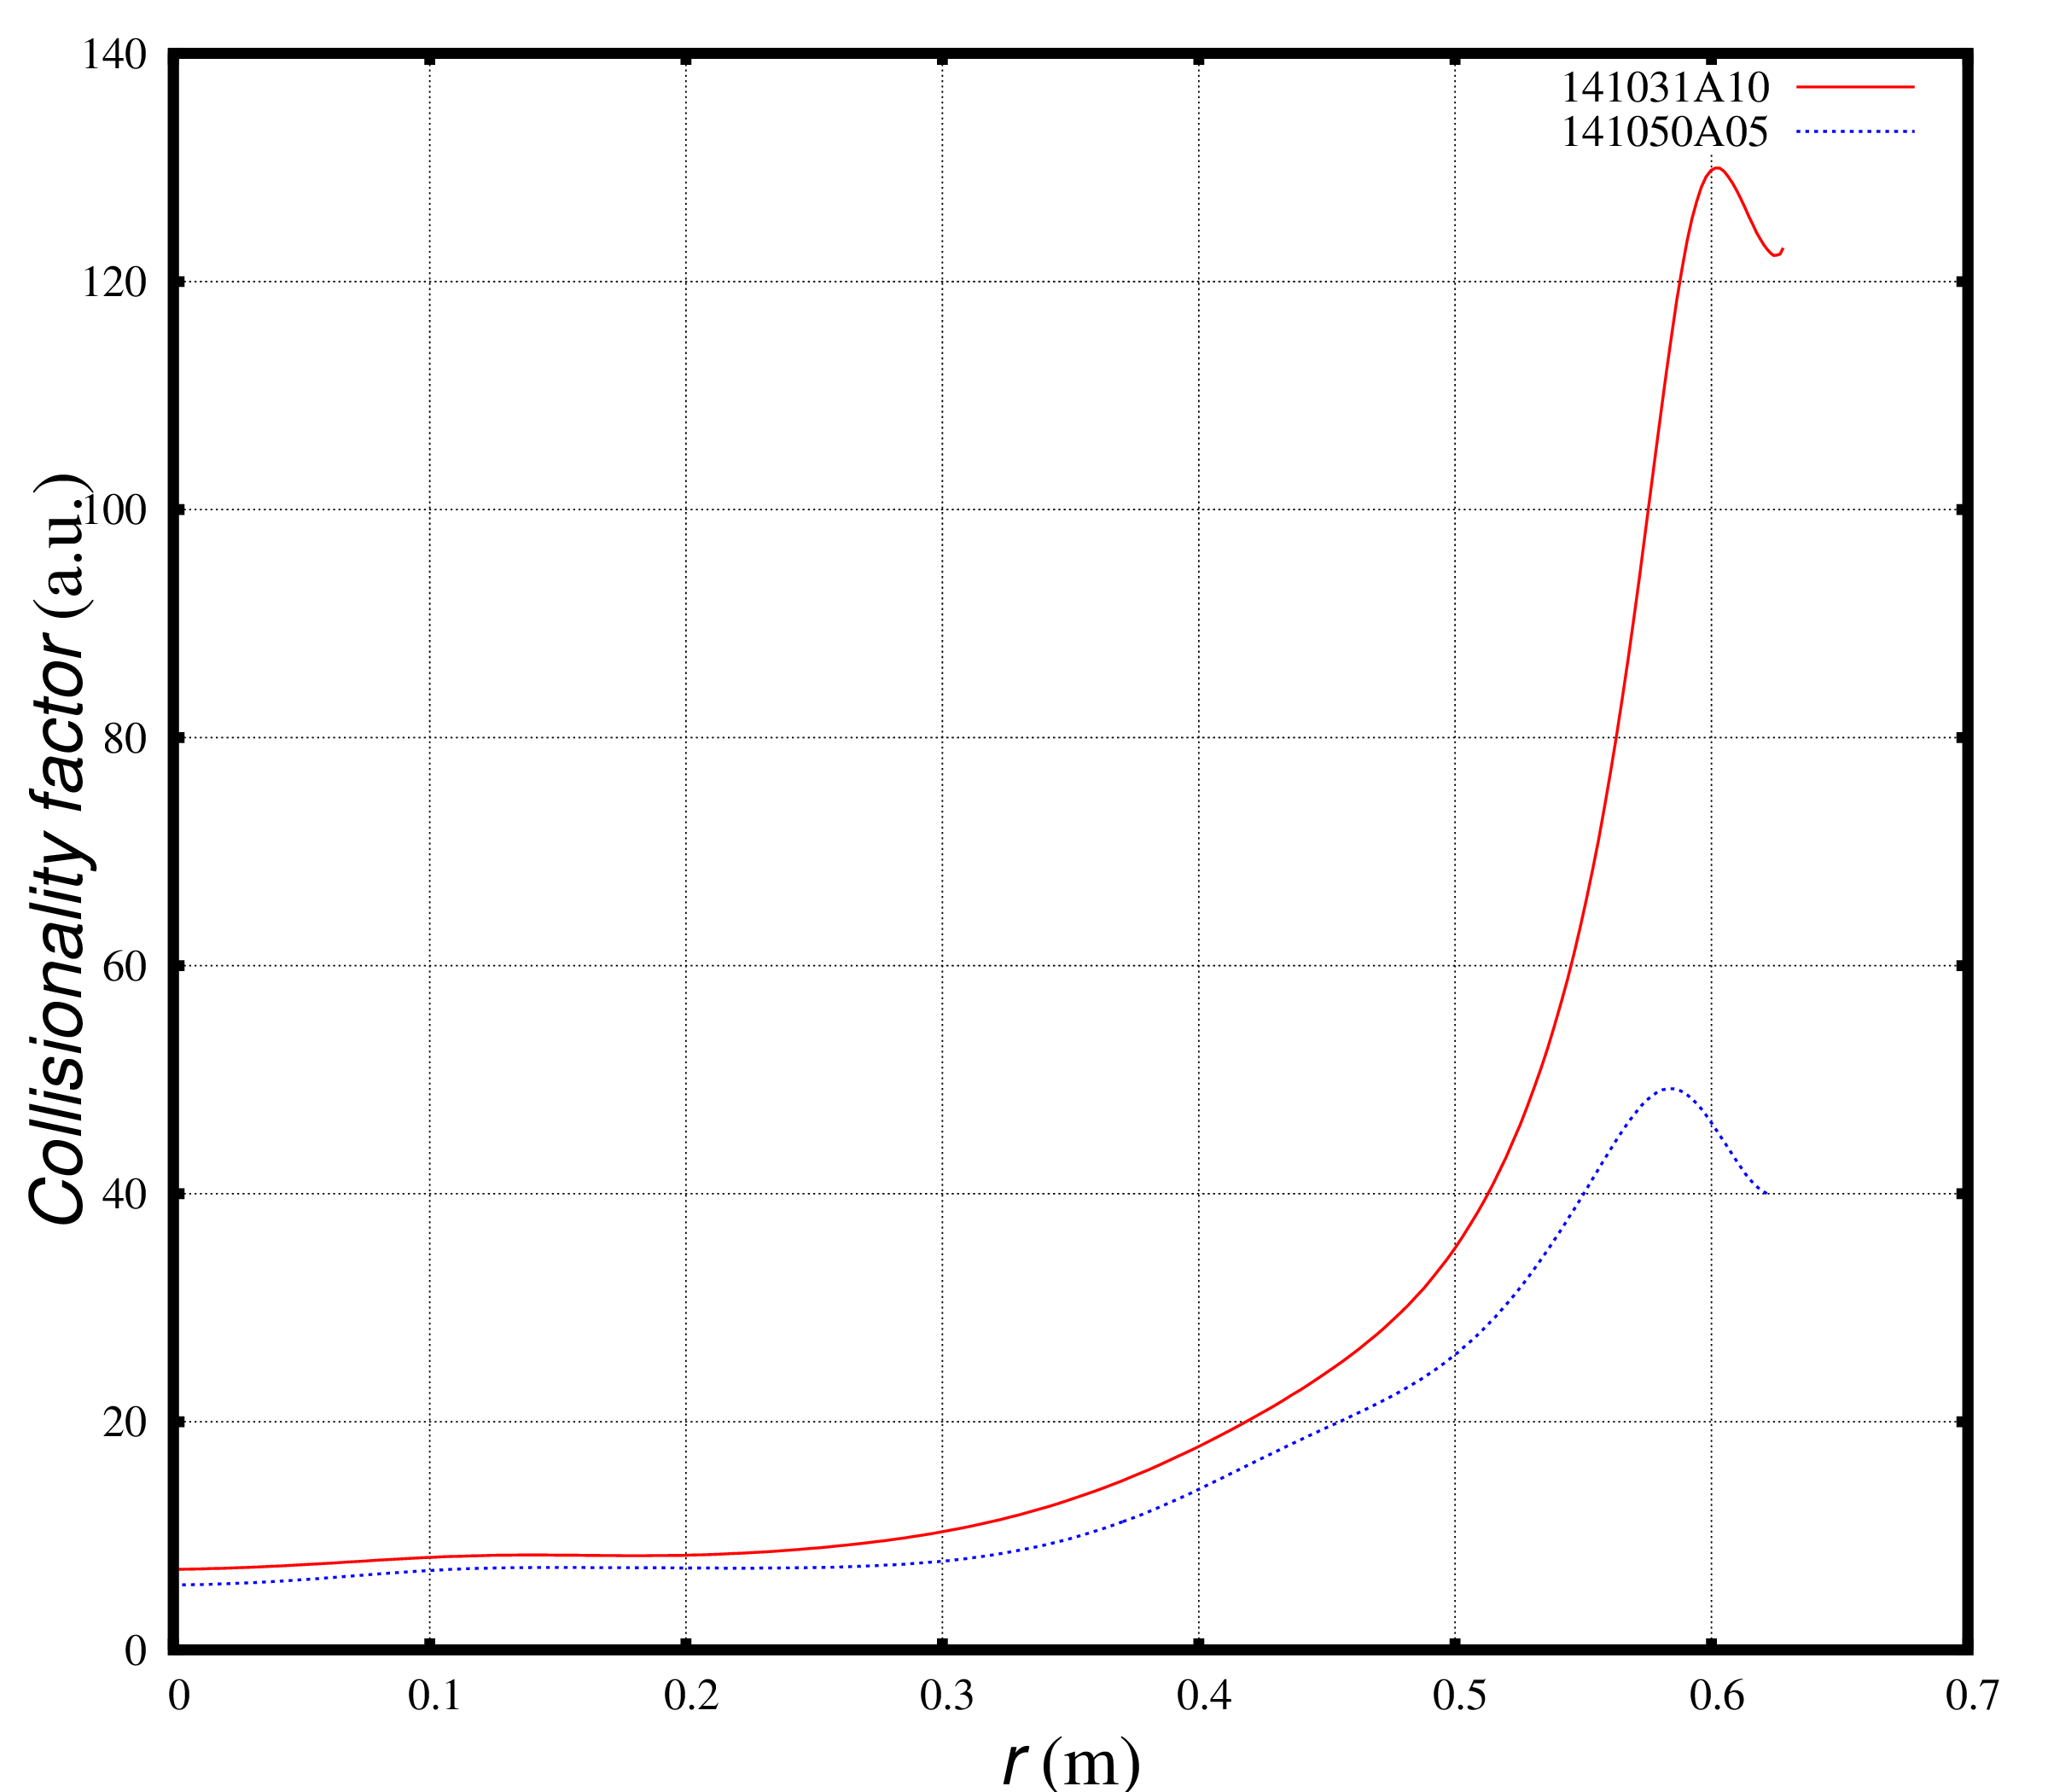
If collisionality is evaluated using the expression , the difference in collisionality between two NSTX discharges is several percents in the plasma core and increases to about 25% at r = 0.5 m. The plasma collisionality in the NSTX discharge 141031 is above the collisionality in the discharge 141040 for all radii:
Collisionality in the NSTX discharges 141031 and 141040.
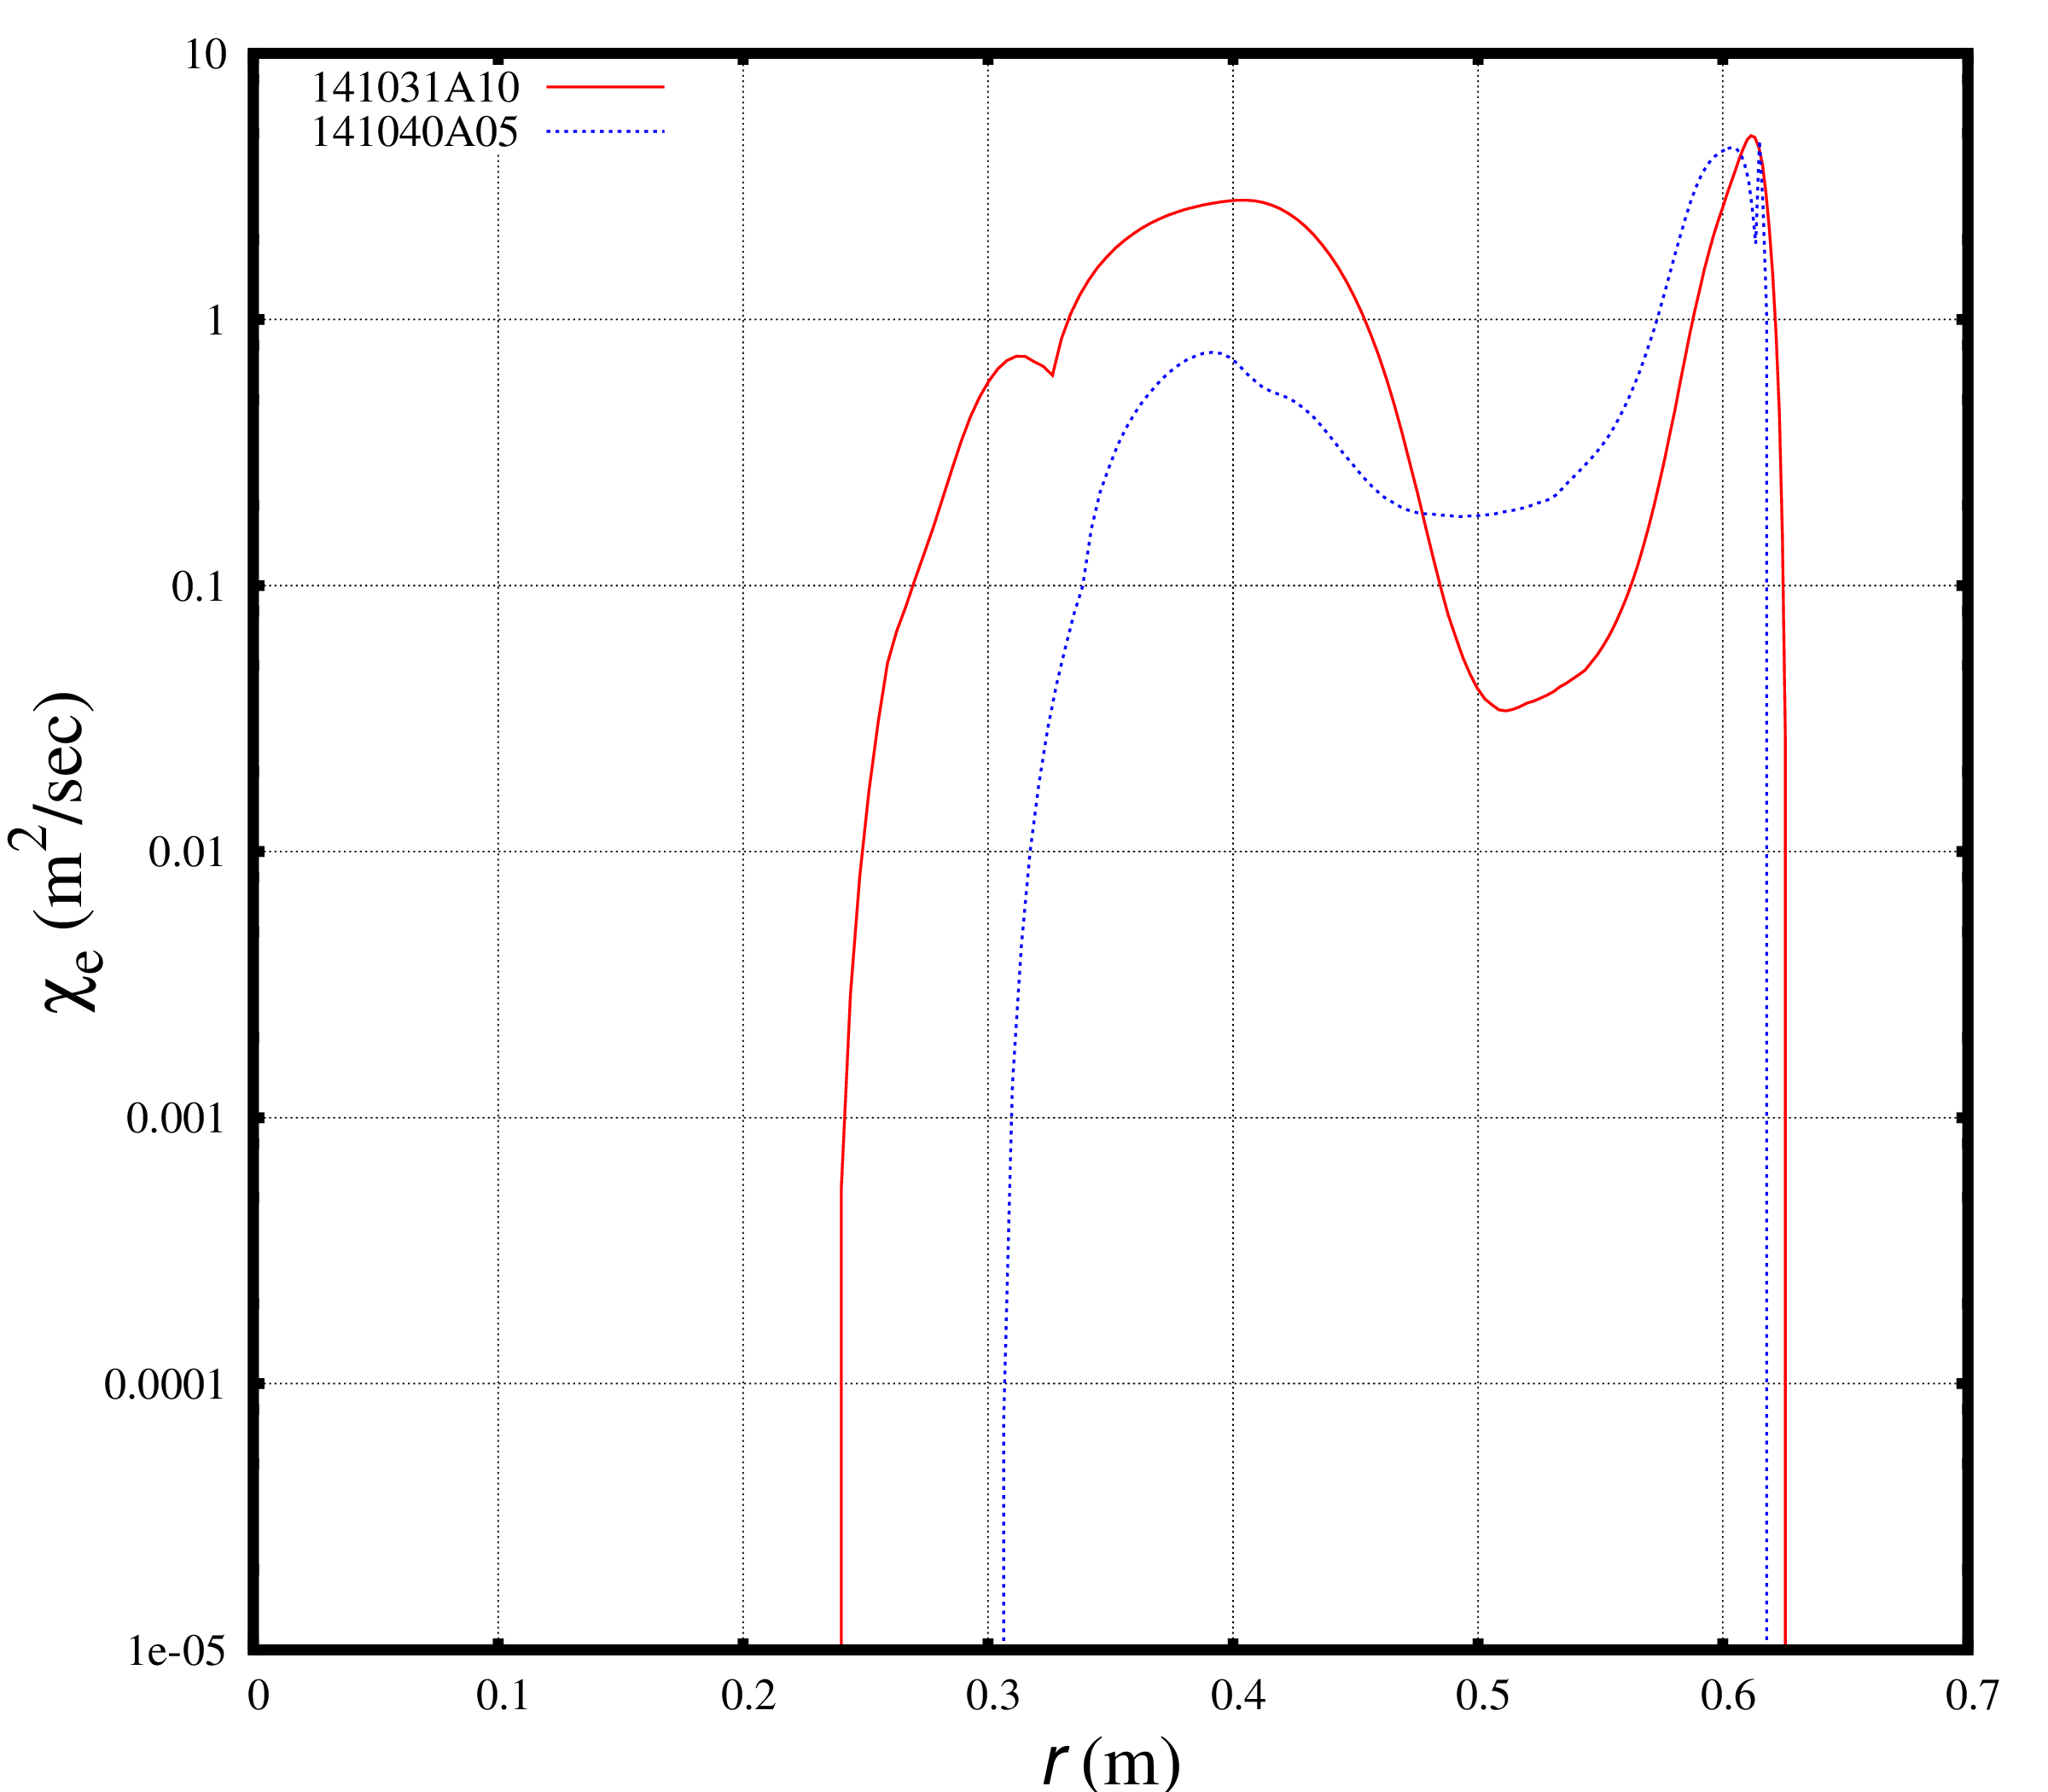
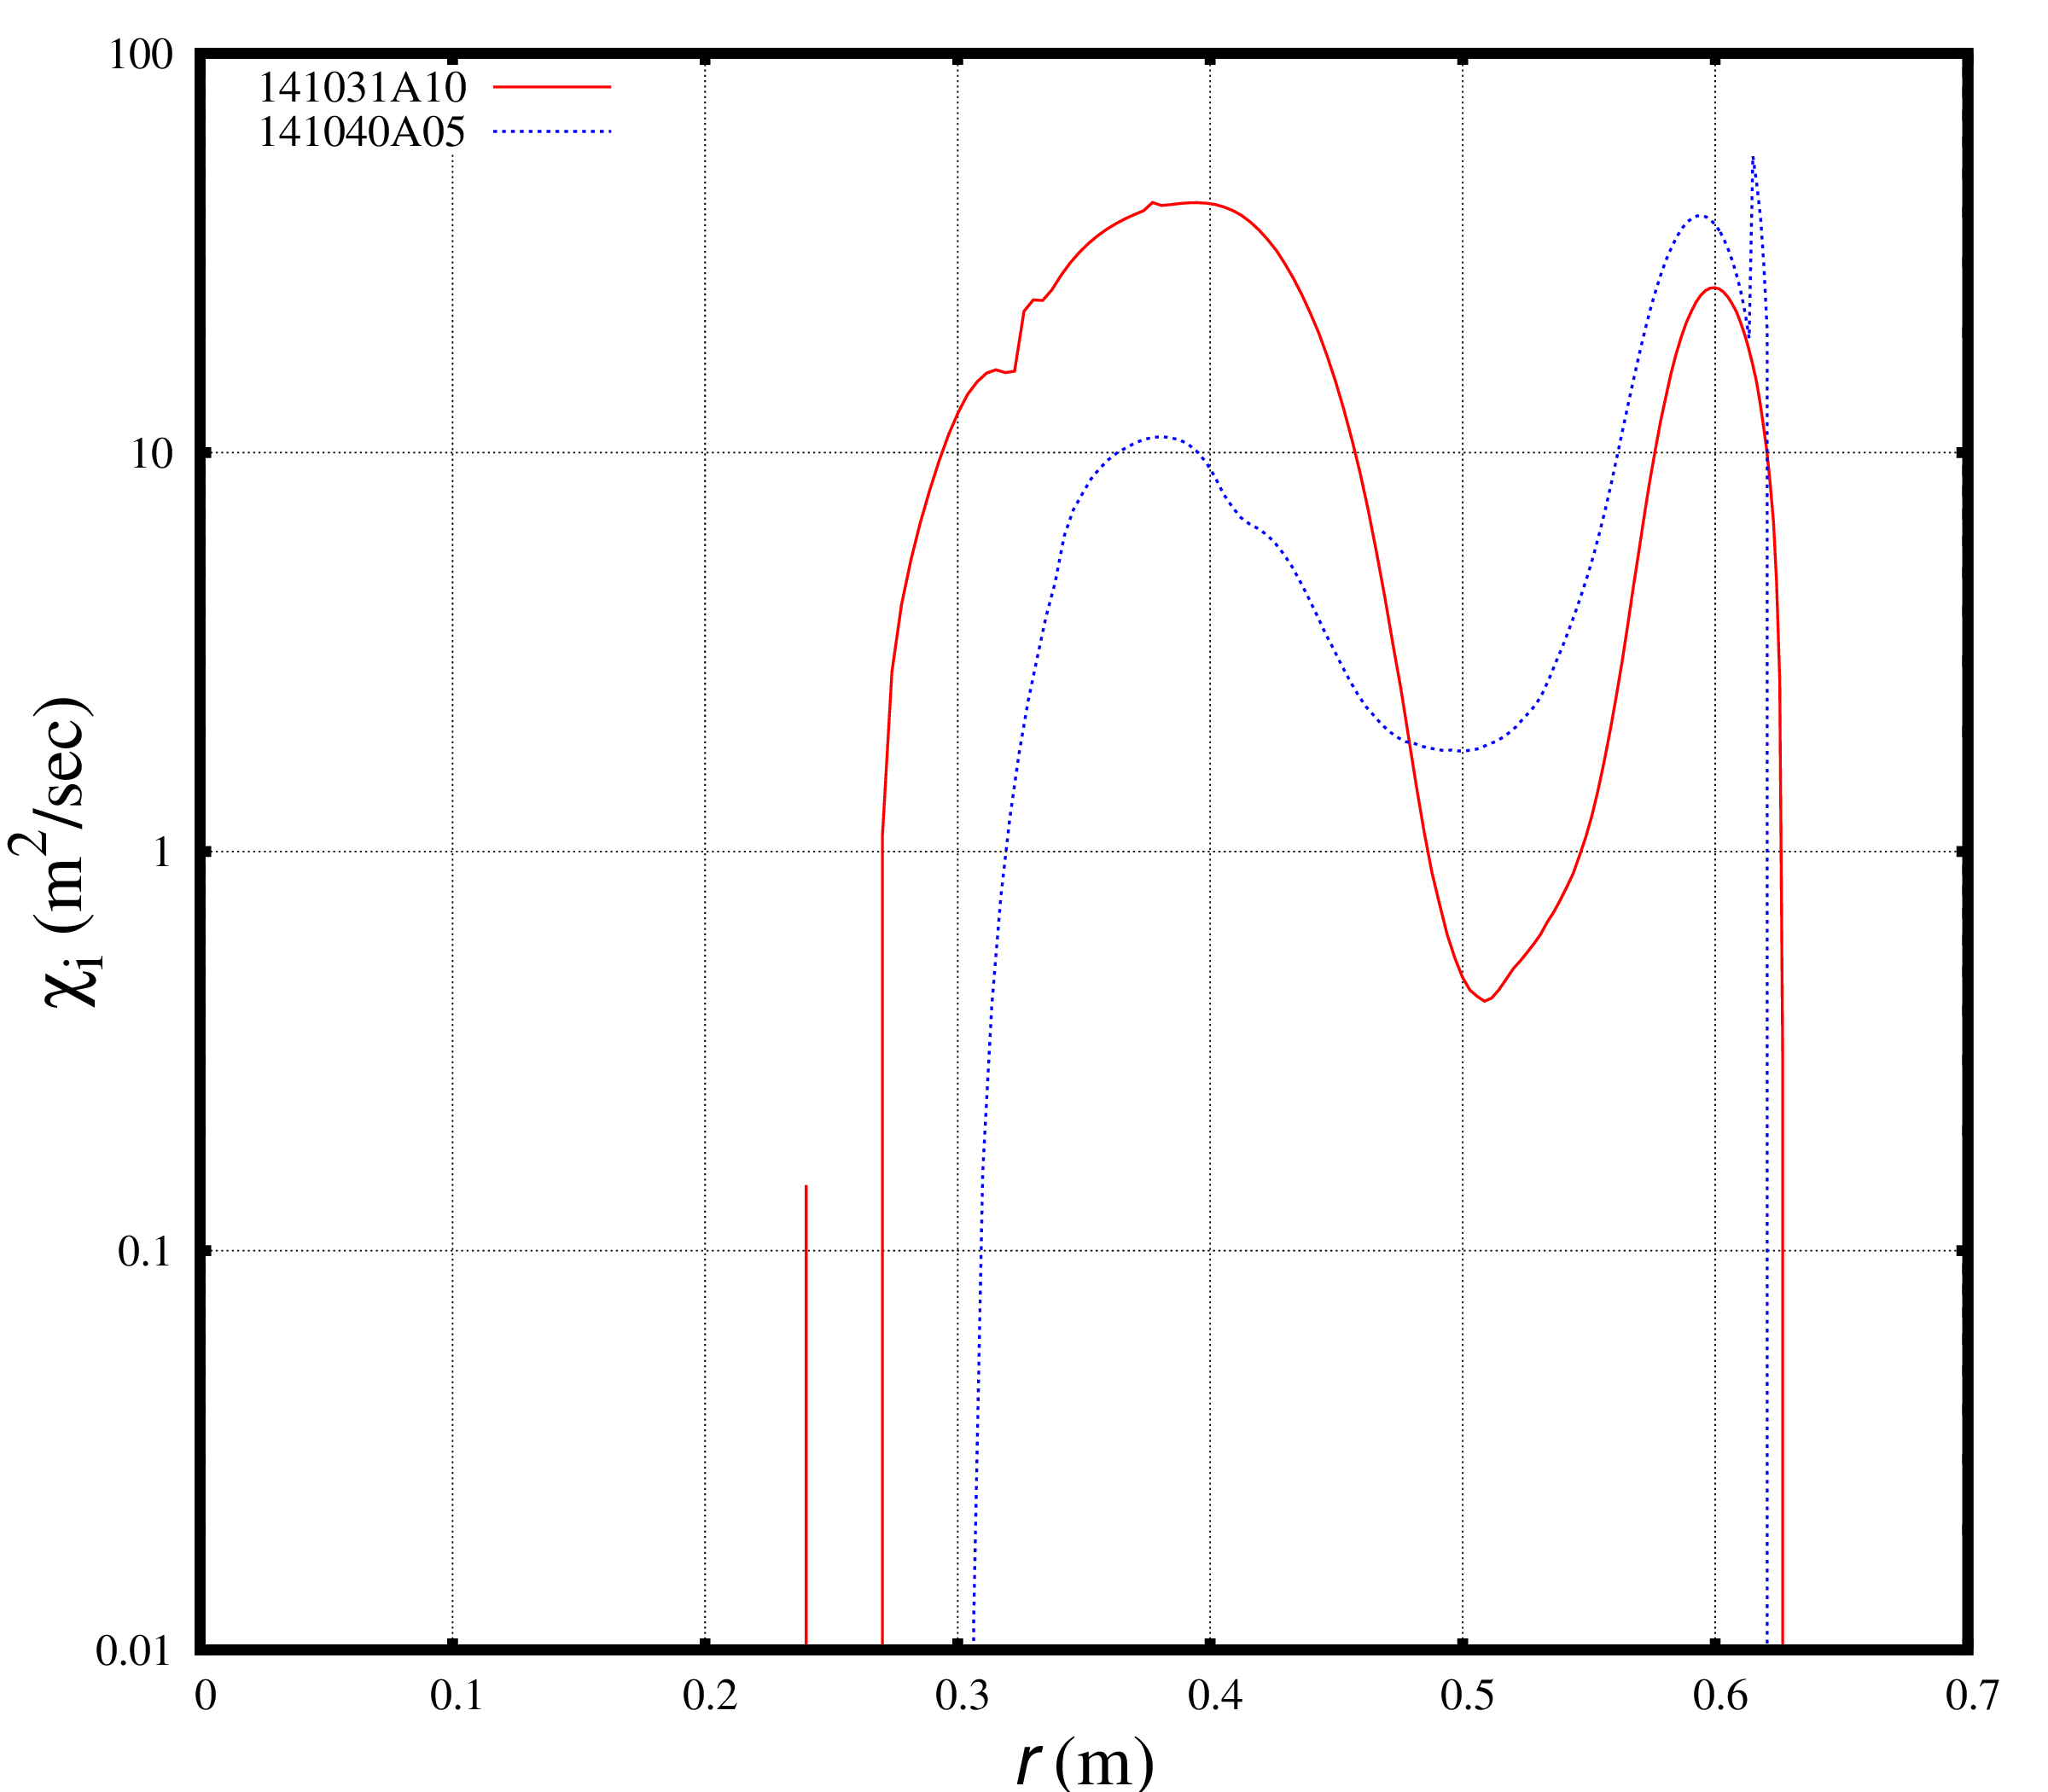
Being tested directly in the MMM8.1 model, the anomalous diffusivities for the NSTX discharge 141031 are found above the anomalous diffusivities for the NSTX discharge 141040. This statement is not true in the H-mode pedestal region where the results from anomalous transport models are not reliable. Smaller anomalous diffusivities are likely to result in better energy confinement times. The predicted energy confinement for the NSTX discharge 141040 is likely to be better than the predicted energy confinement for the NSTX discharge 141031. This is in agreement with the experimental trends for these two discharges.
Electron thermal diffusivity
Ion thermal diffusivity
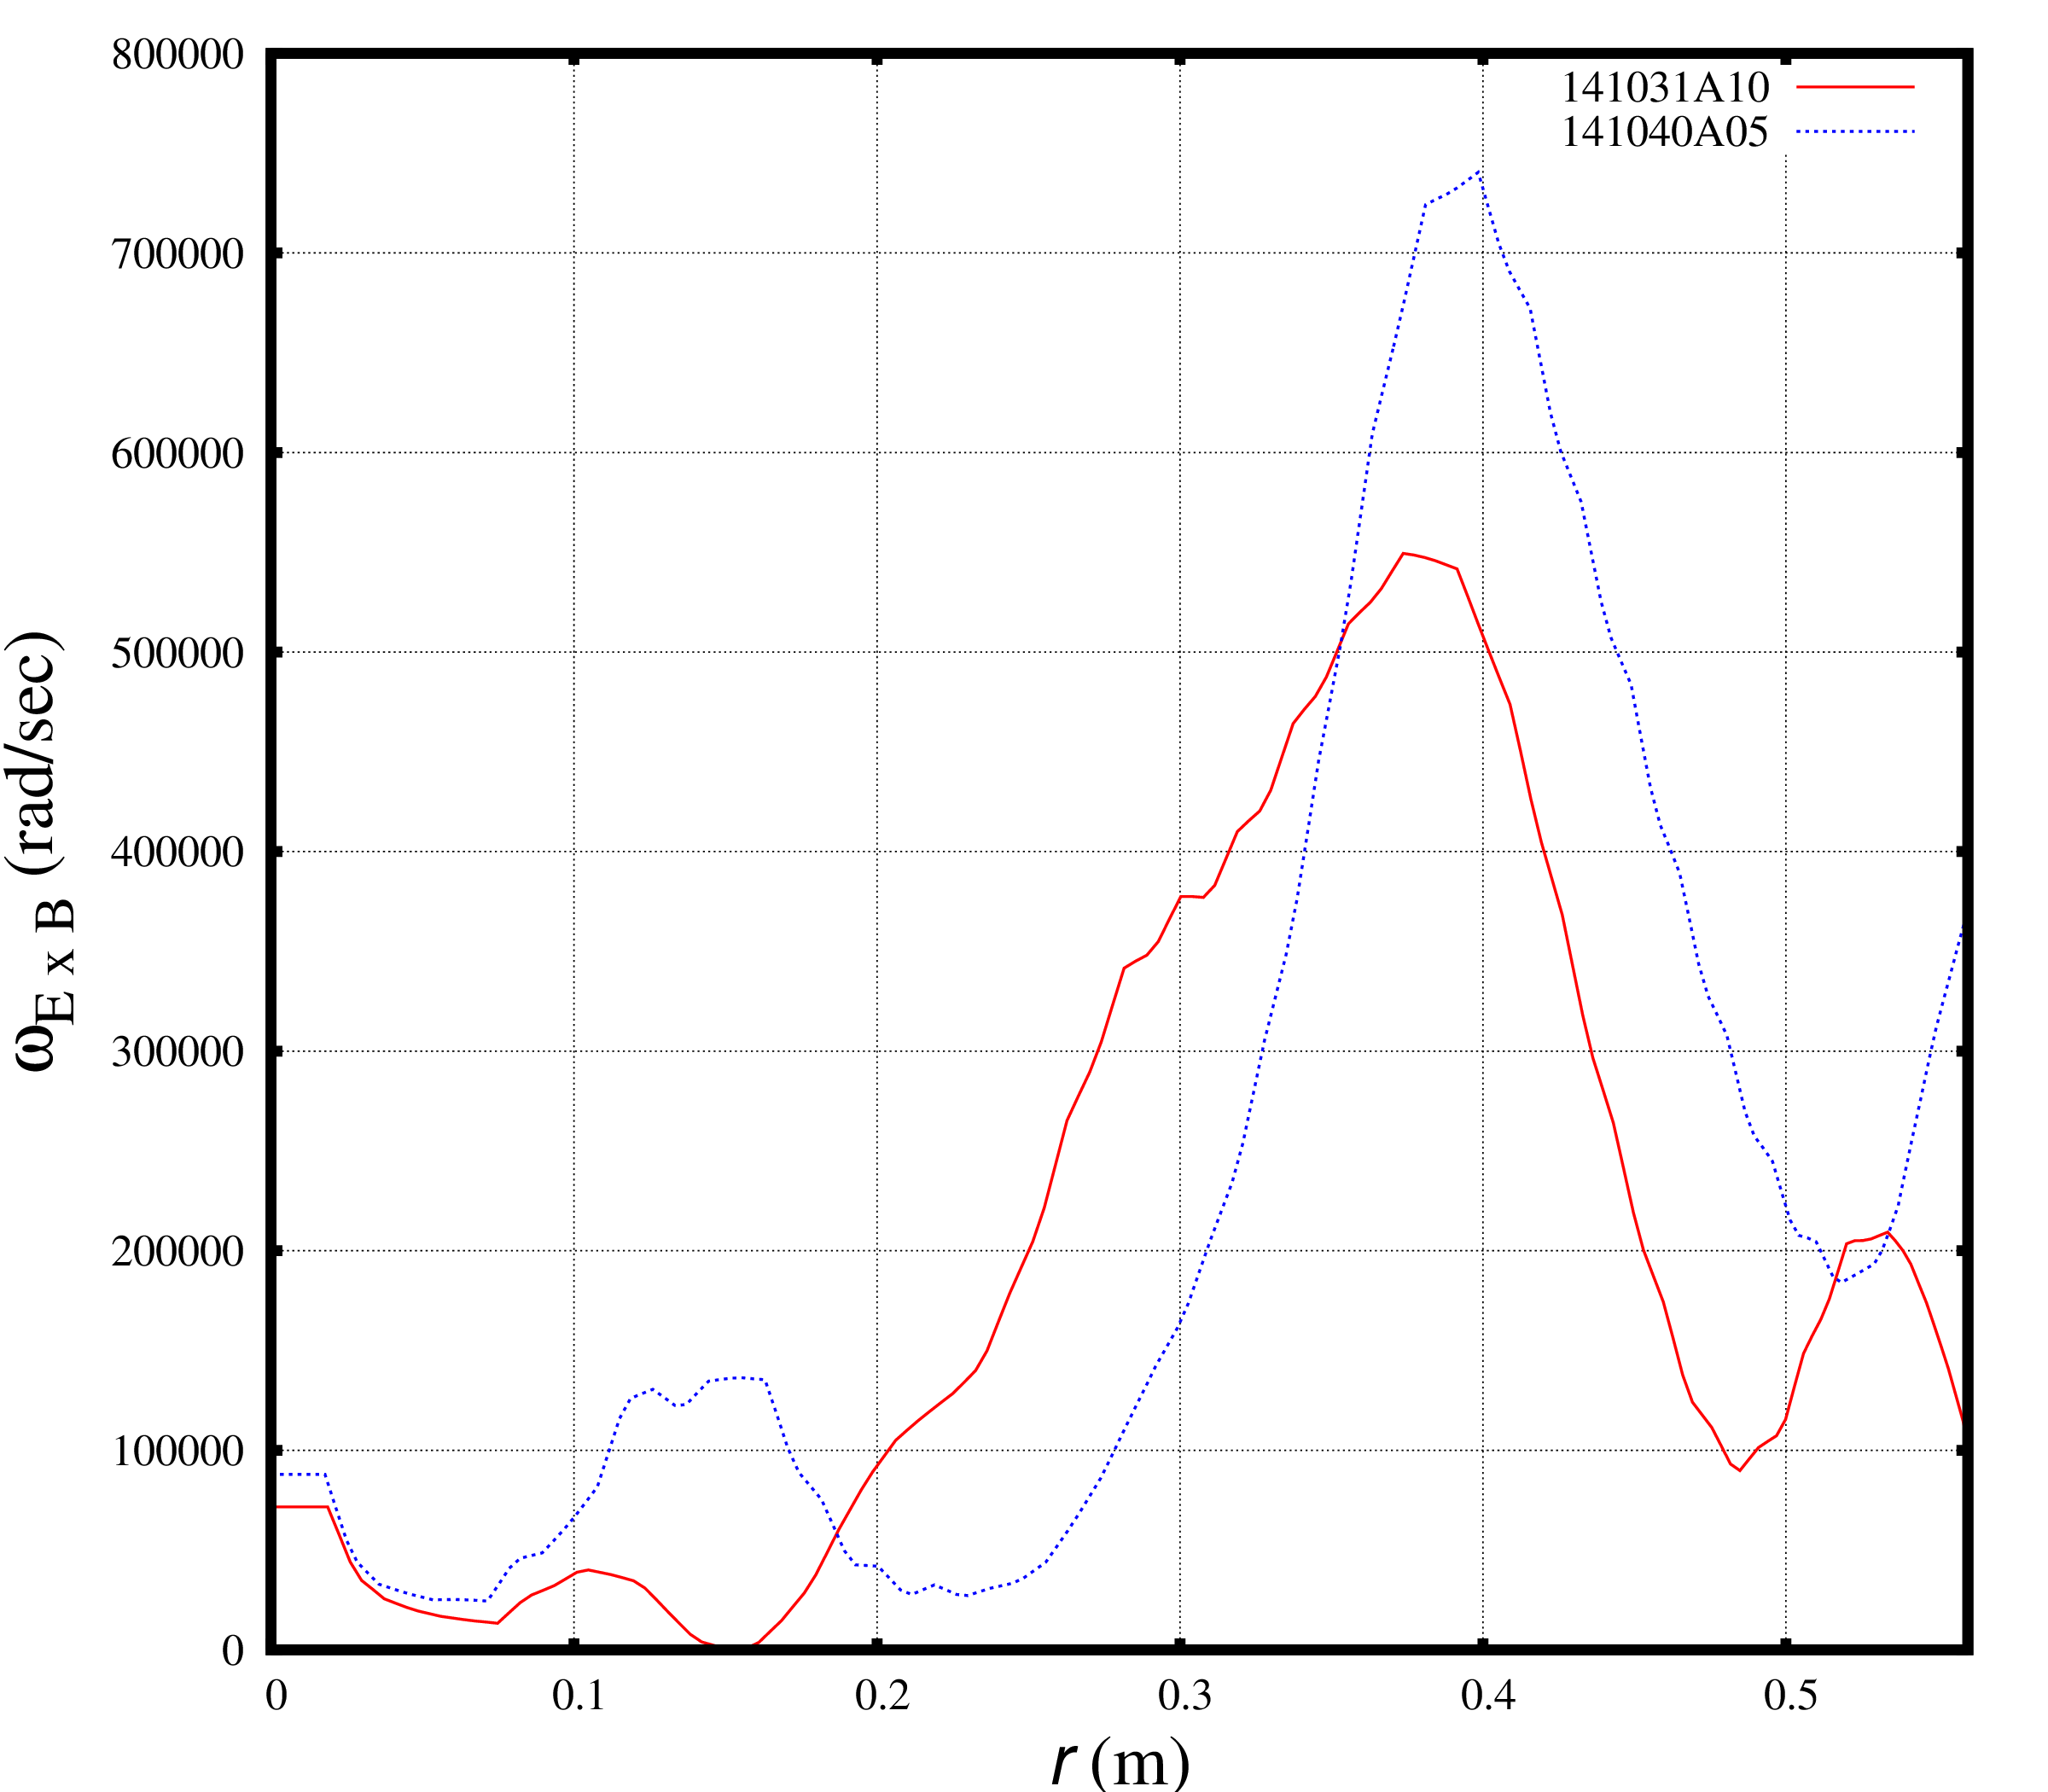
The observed dependence of the anomalous diffusivities on the collisionality is not necessary comes from the model, but might be associated with the differences in other profiles and plasma parameters that are difficult to maintain constant between discharges. In particular, in order to isolate the collisionality and ExB flow shear effects, the ExB flow shear profiles were set to zero in these tests. The ExB flow shear profiles between the two NSTX discharge are different:
The ExB flow shear profiles
The ExB flow shear rates for the NSTX discharge 141031 are above the ExB flow shear rates for the discharge 141040 in the plasma region from r=0.18m to r=0.5m and below the ExB flow shear rates in the outer plasma region from r=0.8m. In particular, the ExB flow shear rates are large in the region from r=0.35m to r=0.45m. While neglected in the direct tests with the MMM8.1 model, the ExB flow shear rates were used in the TRANSP predictive simulations last week.
In order to eliminate possible effects from other plasma parameters that are different for the NSTX discharges 141031 and 141040, independent collisionality scans for each discharge are necessary.


") dependence that is observed in predicted TRANSP simulations and in experiment. The Weiland component that computes fluxes associated with most drift-wave instabilities such as ITG modes in the plasma core shows that the electron and ion thermal diffusivities are stabilized by the plasma collisionality. This effect is expected because of known dumping effect of plasma collisionality on the drift-wave modes. There are two possible explanations of the discrepancies between predictive and standalone MMM8.1 runs.
dependence that is observed in predicted TRANSP simulations and in experiment. The Weiland component that computes fluxes associated with most drift-wave instabilities such as ITG modes in the plasma core shows that the electron and ion thermal diffusivities are stabilized by the plasma collisionality. This effect is expected because of known dumping effect of plasma collisionality on the drift-wave modes. There are two possible explanations of the discrepancies between predictive and standalone MMM8.1 runs.
") dependence is partially recovered. The differences between safety factor and magnetic shear profiles can not completely explain the differences in the
dependence is partially recovered. The differences between safety factor and magnetic shear profiles can not completely explain the differences in the 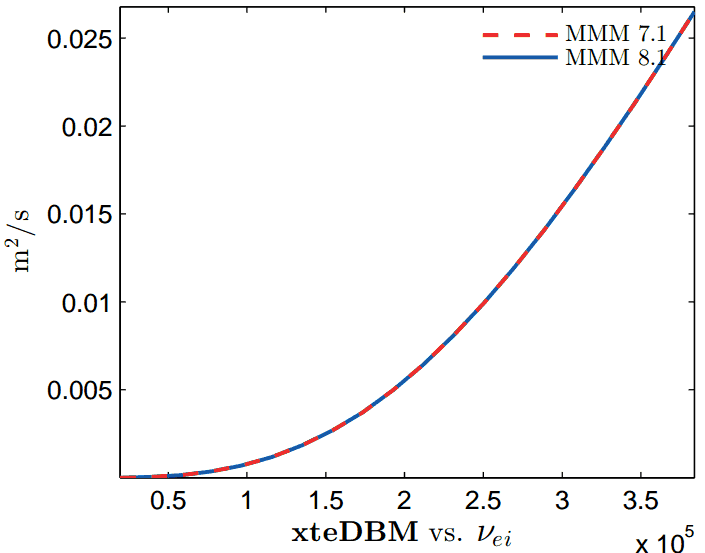
") dependence. When the q and s profiles for the NSTX discharge 141031 are replaced with the corresponding profiles for the discharge 141040, the experimental
dependence. When the q and s profiles for the NSTX discharge 141031 are replaced with the corresponding profiles for the discharge 141040, the experimental 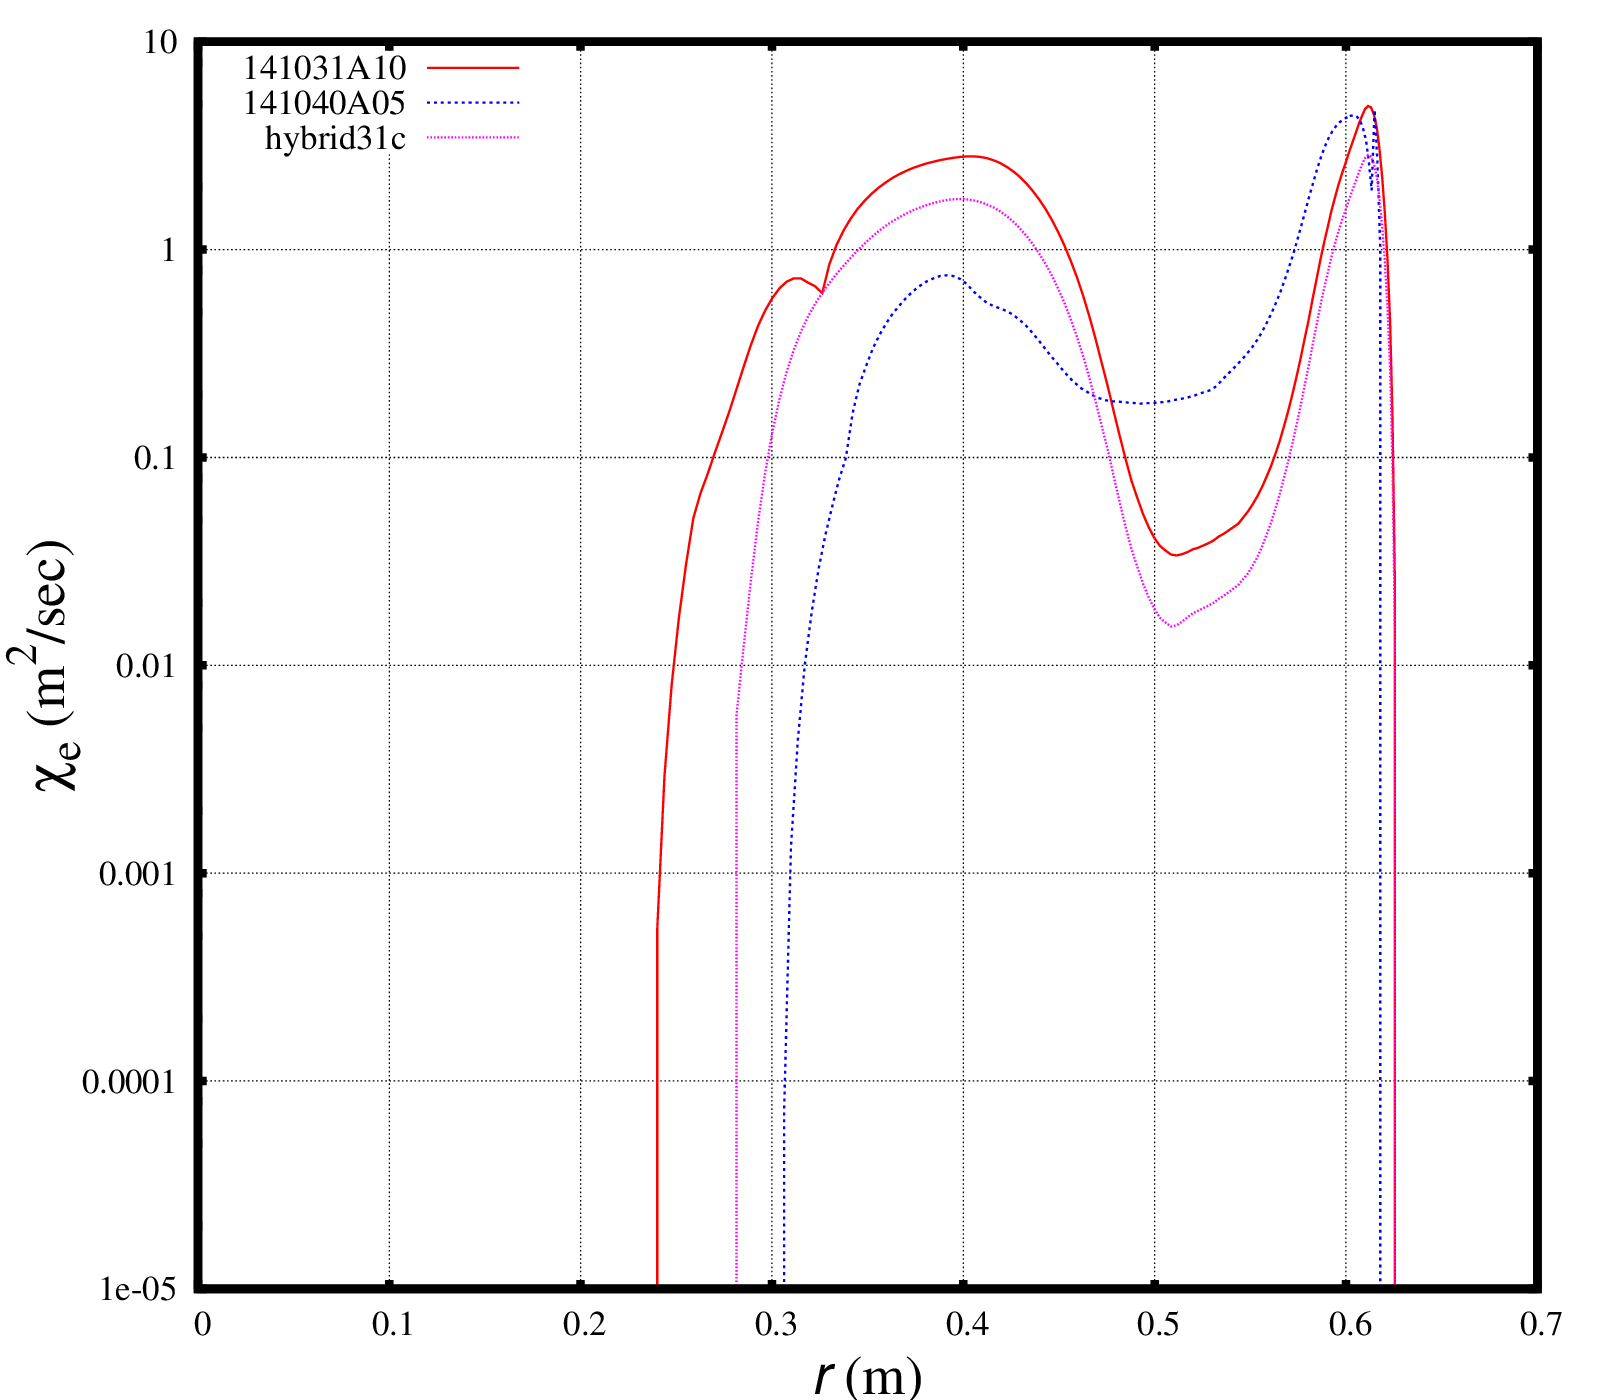
 :
:
 , and
, and  stand for electrons, ions, impurities and fast particles correspondingly. The plasma pressure,
  , normalized gradients and scale lengths as well as ratio of the electron to ion temperatures will remain unchanged.
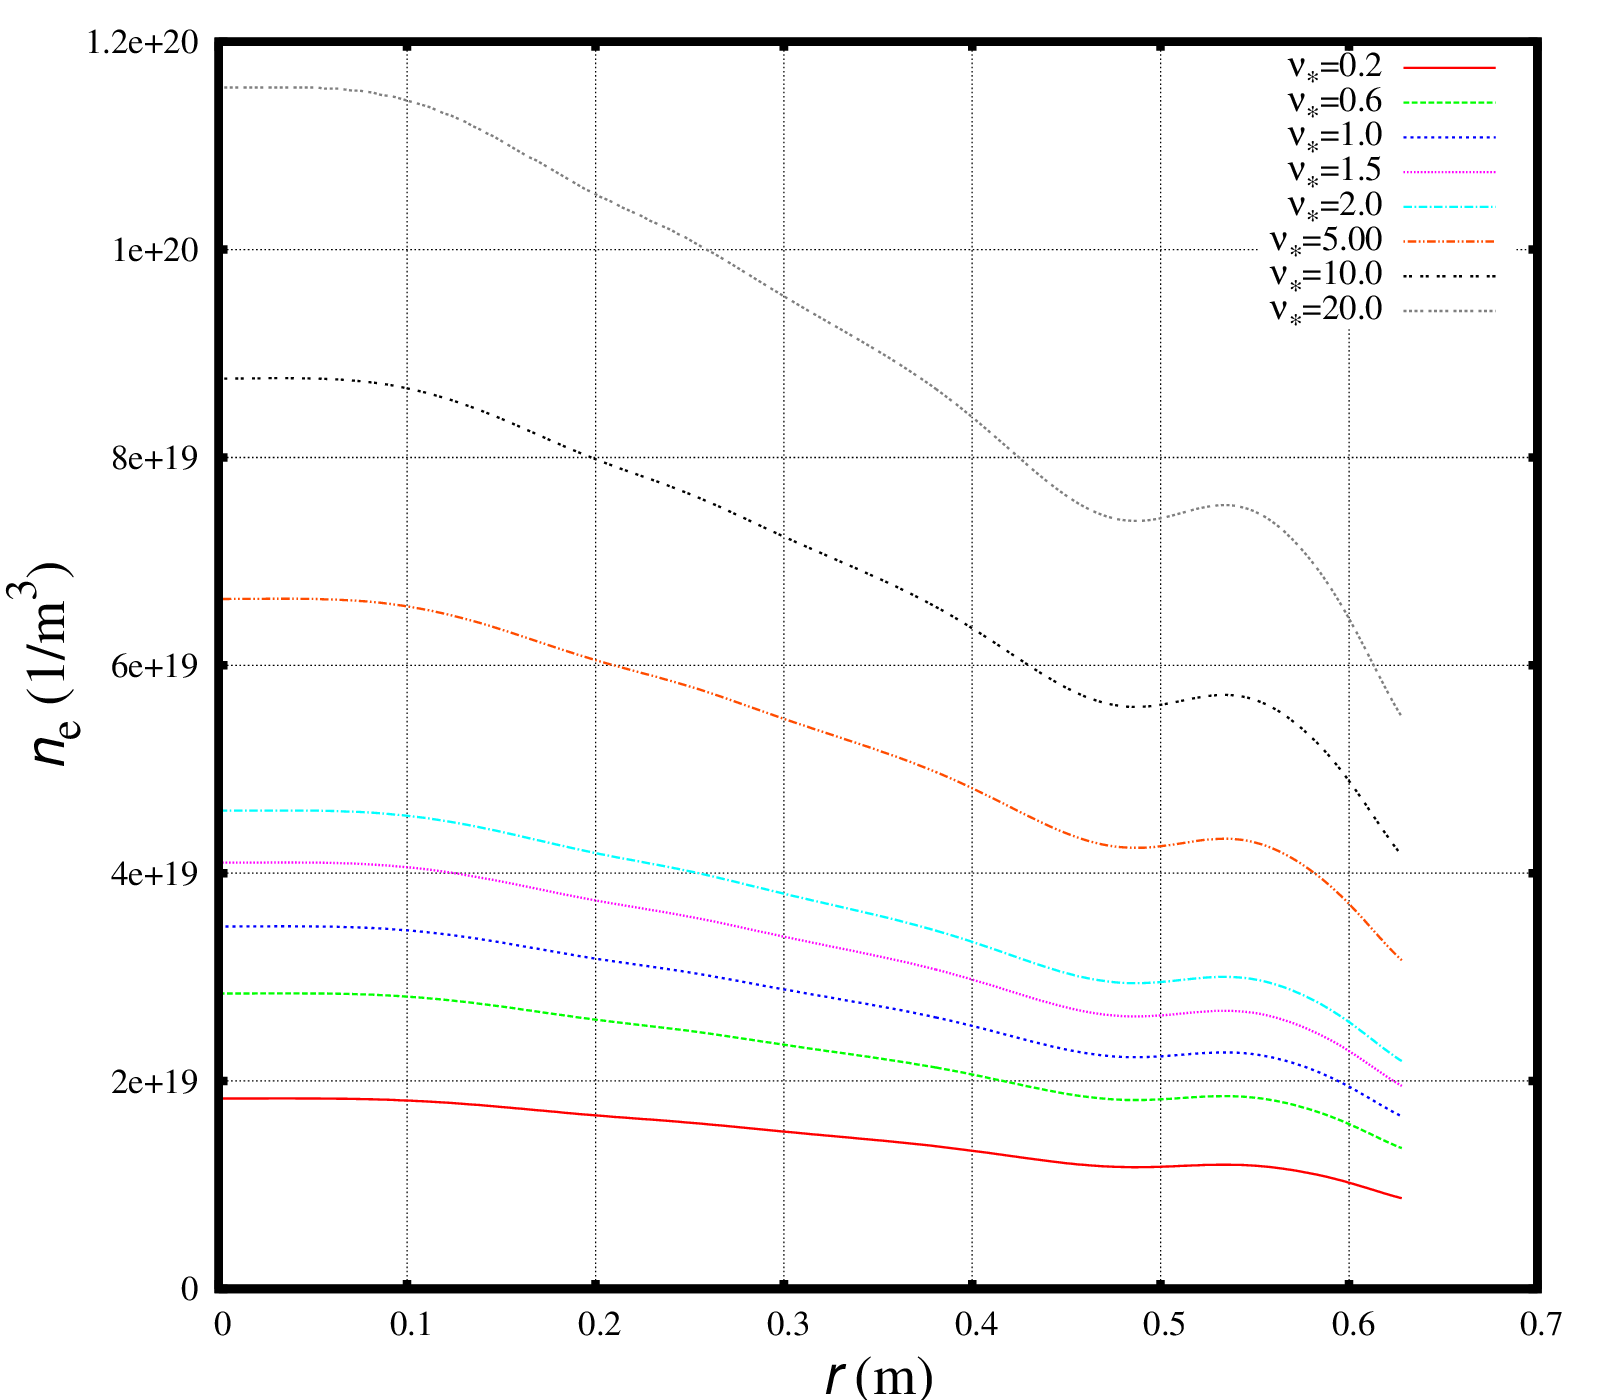
 . However, when used in the whole device integrated modeling code, the MMM8.1 model can reproduce the experimental profiles and
  trend reasonably well. The main remaining question is what are the changes in other profiles (e.g., safety factor and magnetic shear) can change the
 ") dependence.
dependence.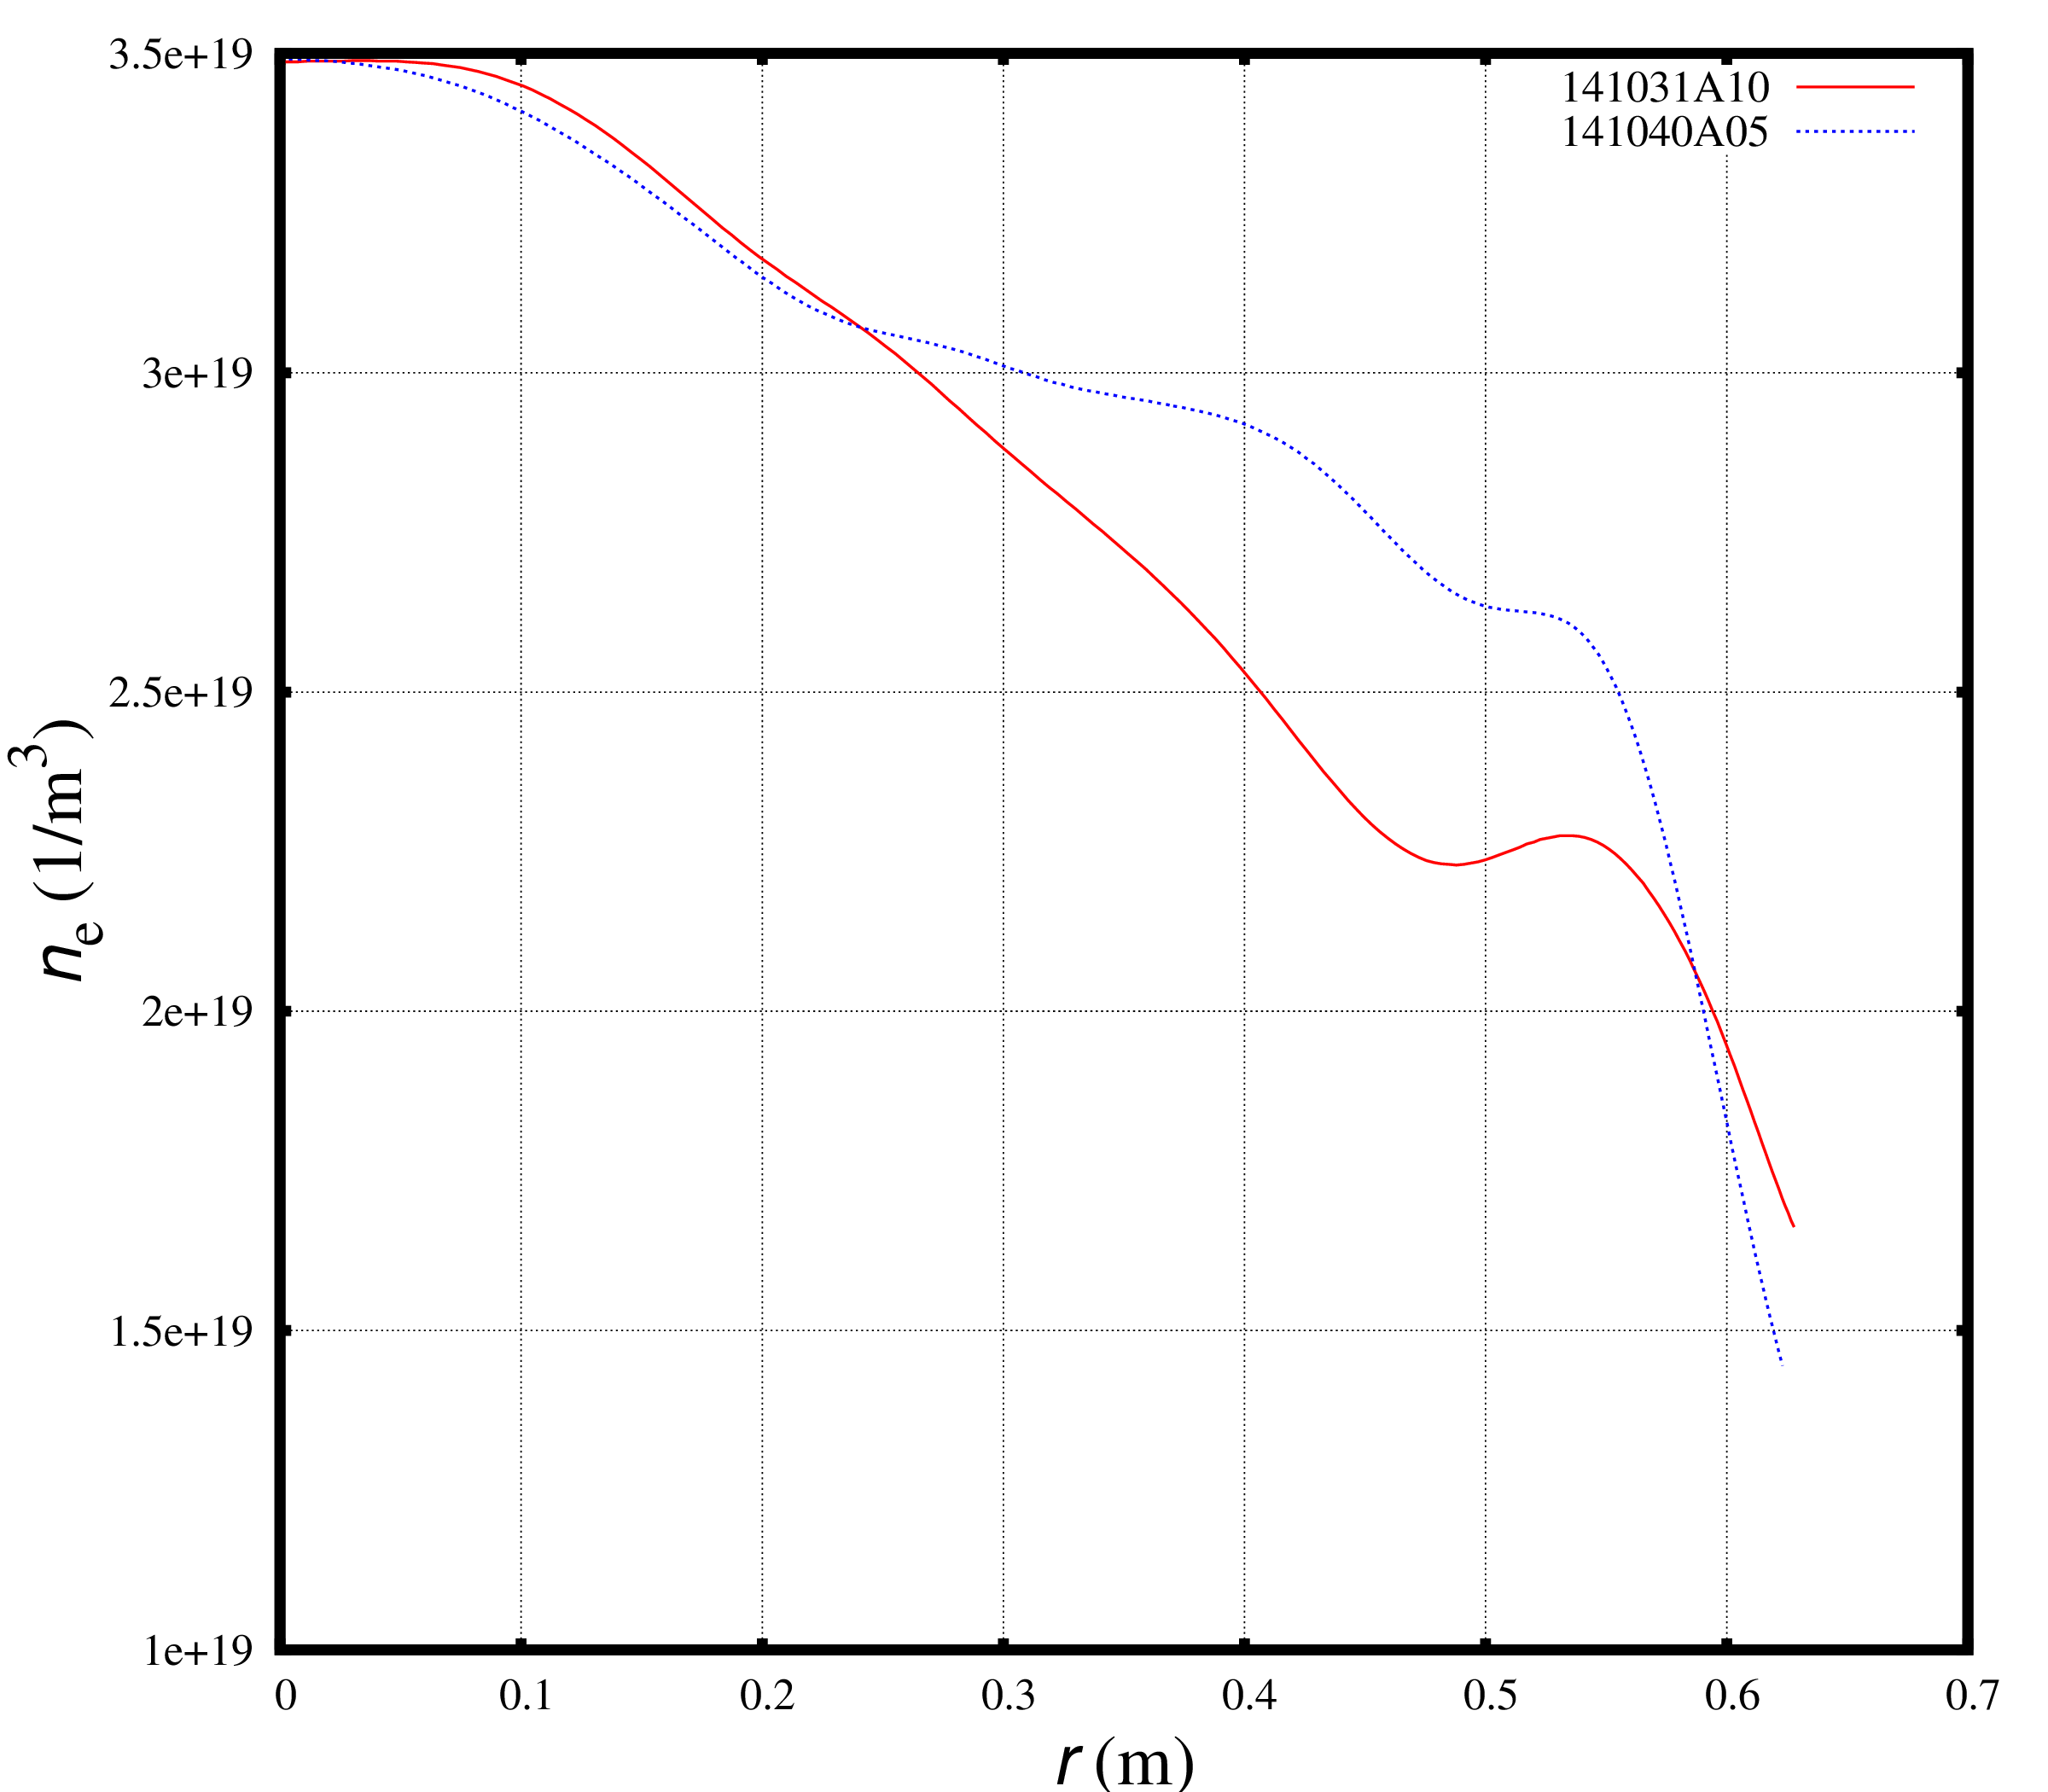
 , the difference in collisionality between two NSTX discharges is several percents in the plasma core and increases to about 25% at r = 0.5 m. The plasma collisionality in the NSTX discharge 141031 is above the collisionality in the discharge 141040 for all radii: