
KSTAR Stability Analysis
The stability map for the KSTAR geometry is generated. The base equilibrium parameters in TOQ are the following:
rmax=47.000000
rzero=177.000000
eshape=2.00
xshape=.64000
totcur=600000.000000
baxis0=20000.000000
The base temperature and density profiles were set using parametric expressions in TOQ using the following parameters:
modelp=27
nedge13=0.7
nped13=2.0
ncore13=5.7
nfactor=1.0
tedgeEV=100.
tpedEV= 500.0
tcoreEV=2000.
widthp=.03
xphalf=.97
The corresponding density profile has the following shape:
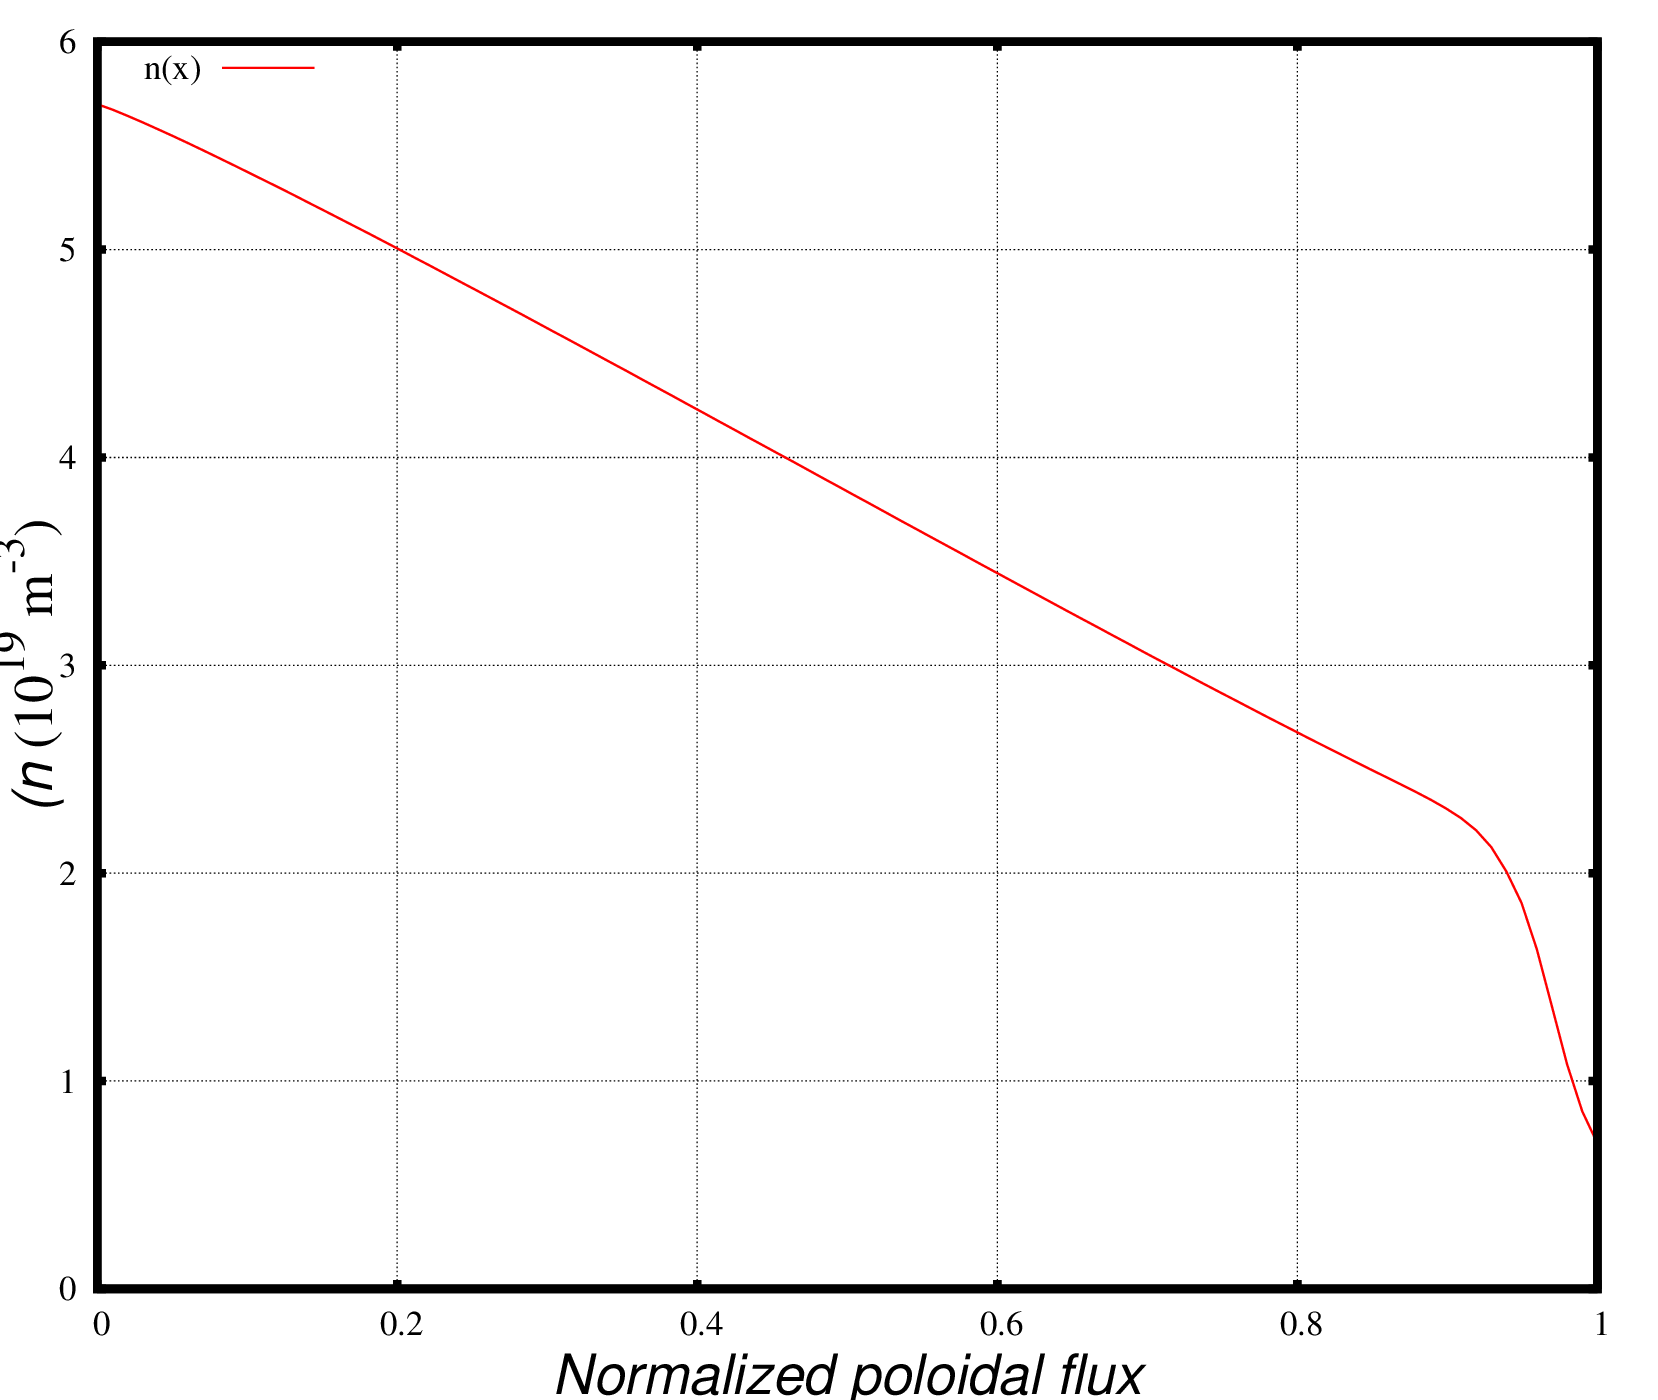
The stability map is generated by varying the nped13, tpedEV and cboot parameters the ranges [0.6:5.5], [100:1600], and [0.1:9] correspondingly. Over 150 new equilibria have been generated. The pedestal stability in these equilbria were tested using the DCON and BALOO codes. The resulting stability map is shown below:
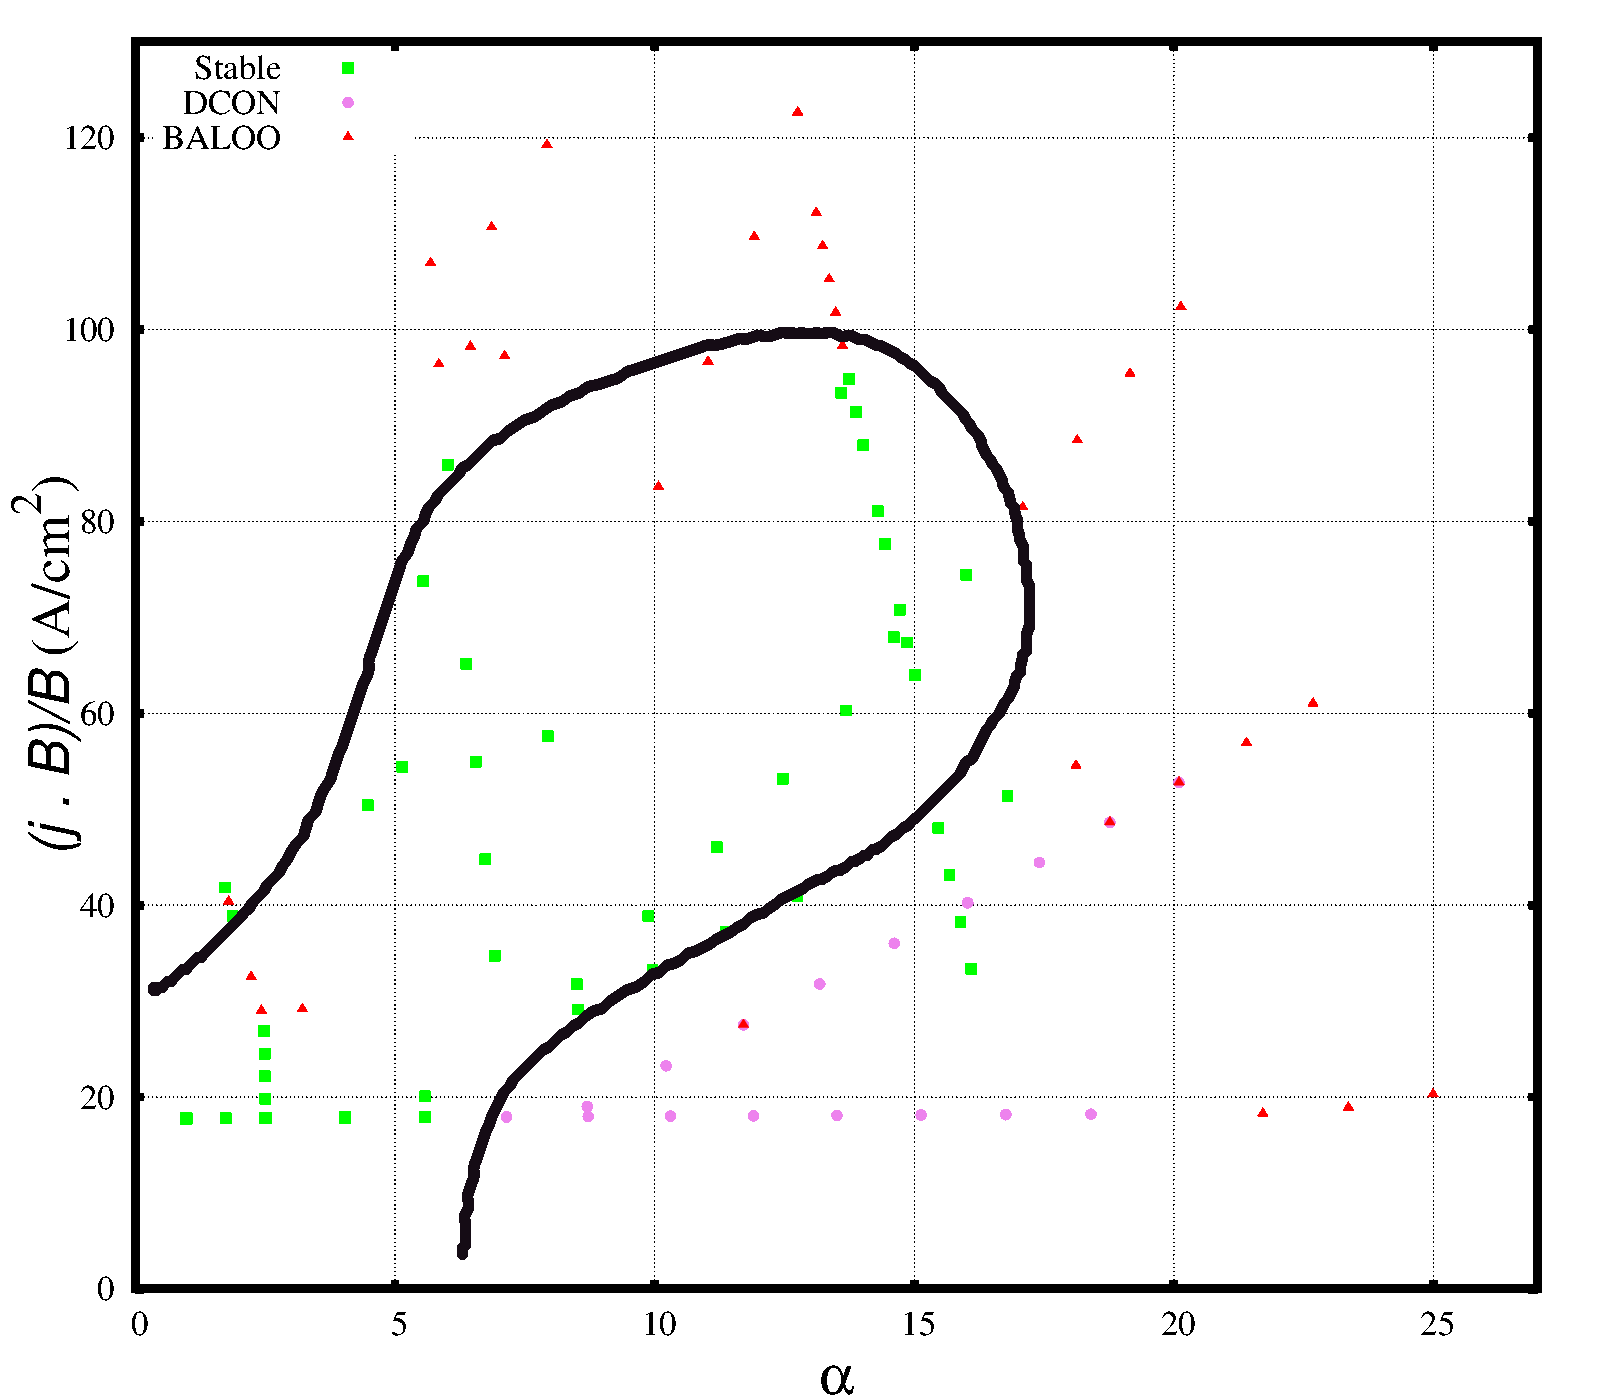
j-alpha stability diagram for KSTAR
Here 

where 


The results are valid for a particular choice of plasma parameters such as 


Leave a Reply