
Modeling of the H-mode pedestal buildup in KSTAR using the XGC0 code
Four cases has been created based on the equilibrium for the KSTAR discharge 06123. The original KSTAR equilibrium does not have the H-mode pedestal. The H-mode pedestal structure was selected to have the pedestal width approximately 0.08 of the normalized poloidal flux so that the pedestal top was located at 

")
| Case # | ") |
") |
ptl_charge | Collisionality factor |
|---|---|---|---|---|
| XGC-T85Y | 1.54 | 1.43 | 1 | 1 |
| XGC-T86Y | 3.14 | 0.7 | 1 | 8.5 |
| XGC-T87Y | 4.00 | 0.55 | 1 | 17.56 |
| XGC-T88Y | 4.92 | 0.447 | 2 | 65.39 |
For all four cases, I used the following assumption for the anomalous transport:
! particle transport
tbl_D_coeff_in=0.7D0 ! m^2/sec, inside (pedestal top) value of D_turb
tbl_D_coeff=0.04D0 ! m^2/sec, outside (pedestal bottom) value of D_turb
tbl_D_coeff2=1.3D0 ! m^2/sec, D_turb for outside of separatrix (SOL+private flux region)
! ion thermal diffusivities
tbl_therDi_coeff_in=0.8D0 ! m^2/sec, inside (pedestal top) value of thermal D_turb for ions
tbl_therDi_coeff=1D-8 ! m^2/sec, outside (pedestal bottom) value of thermal D_turb for ions
tbl_therDi_coeff2=4D0 ! m^2/sec, thermal D_turb for outside of separatrix (SOL+private flux region) for ions
! electron thermal diffusivities
tbl_therDe_coeff_in=1.2D0 ! m^2/sec, inside (pedestal top) value of thermal D_turb for electrons
tbl_therDe_coeff=1D-8 ! m^2/sec, outside (pedestal bottom) value of thermal D_turb for electrons
tbl_therDe_coeff2=4D0 ! m^2/sec, thermal D_turb for outside of separatrix (SOL+private flux region) for electrons
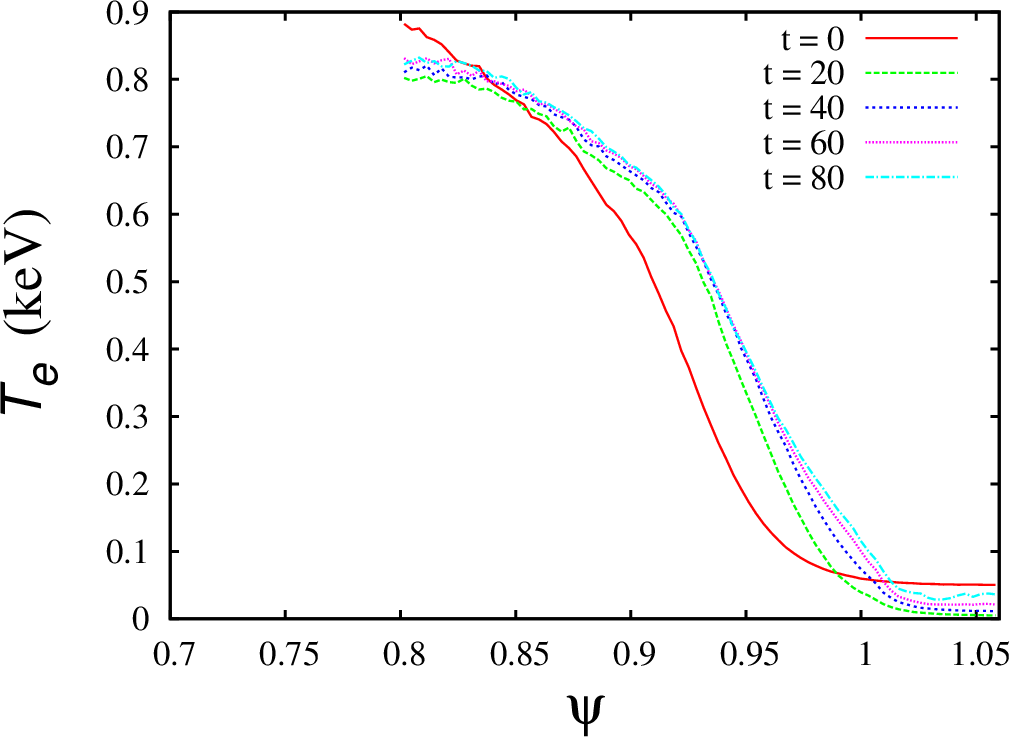
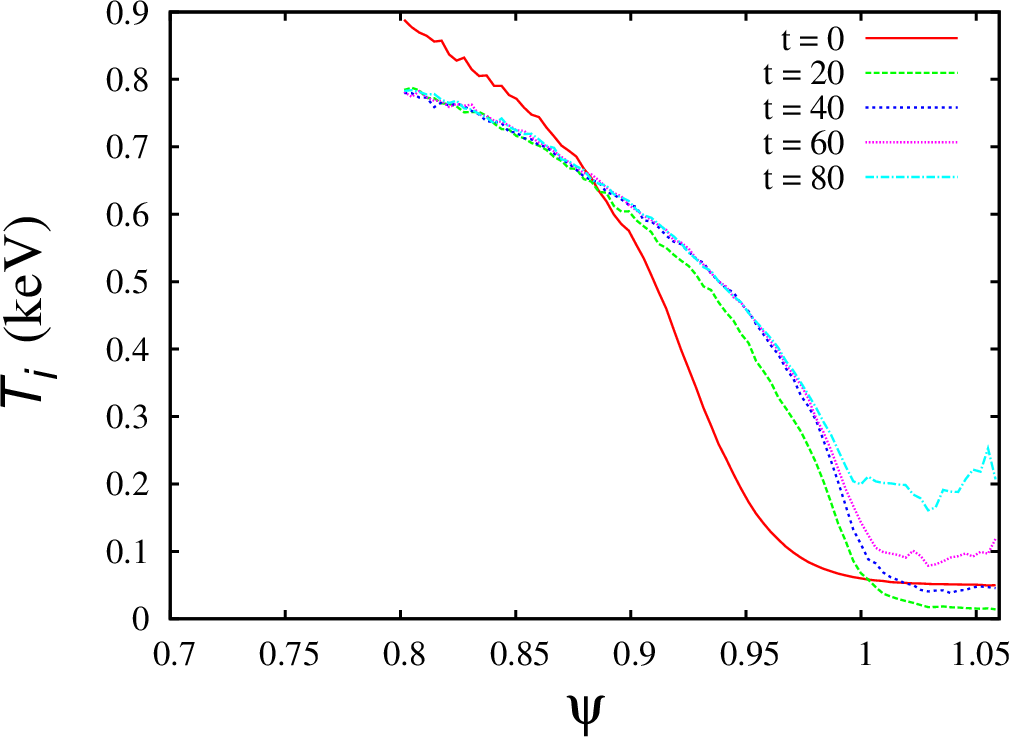
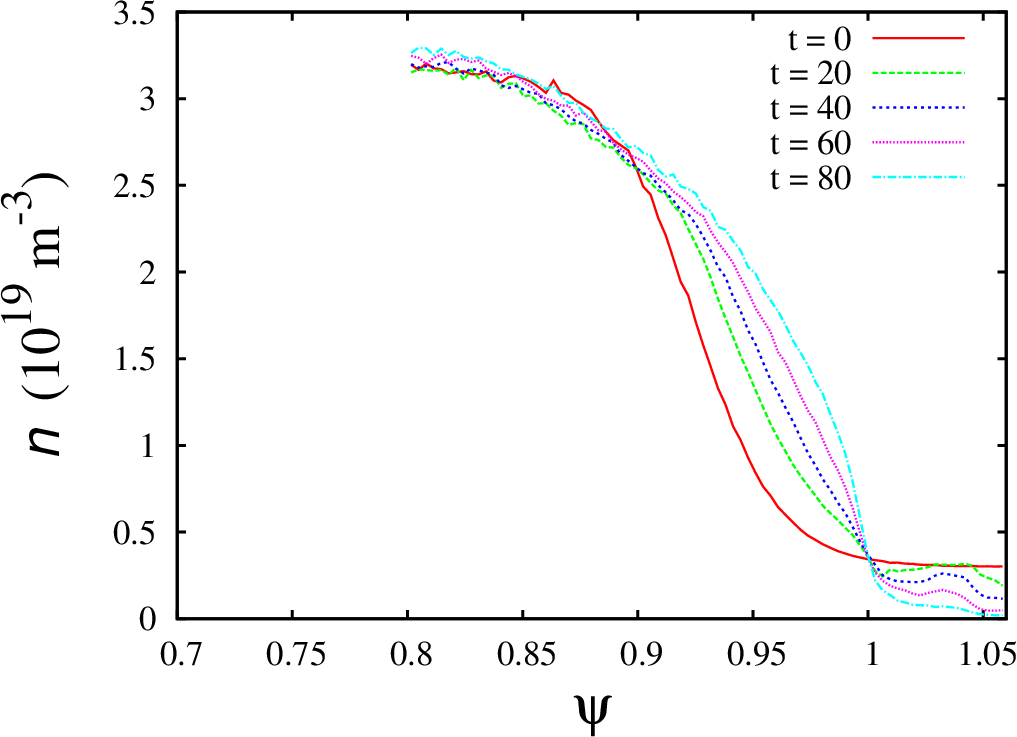
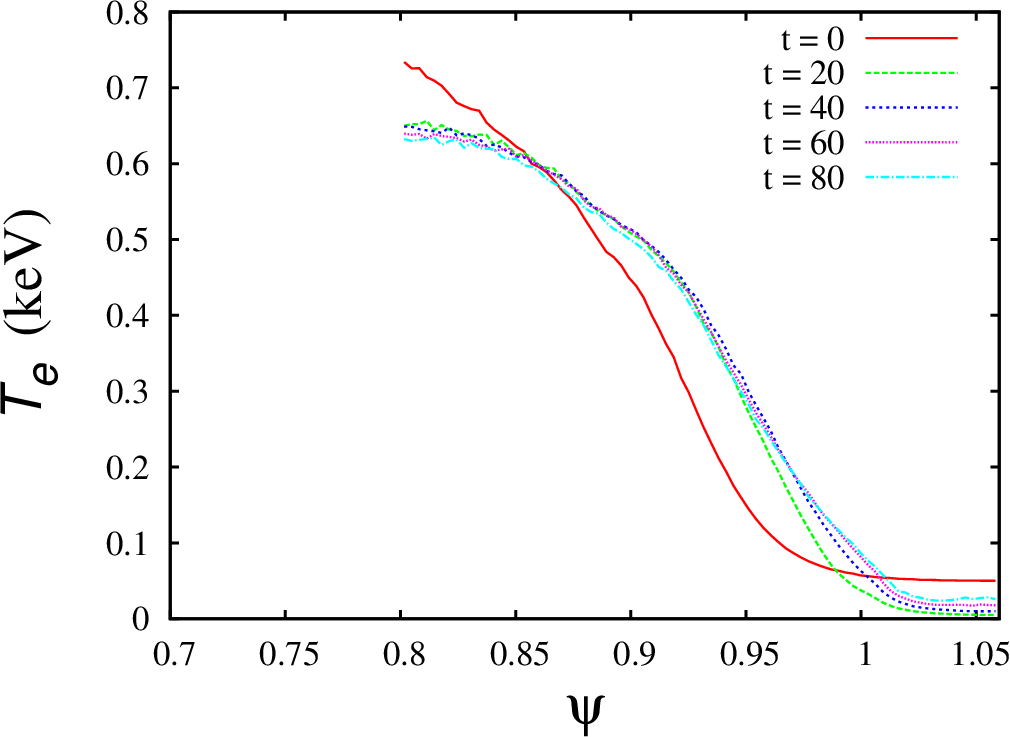
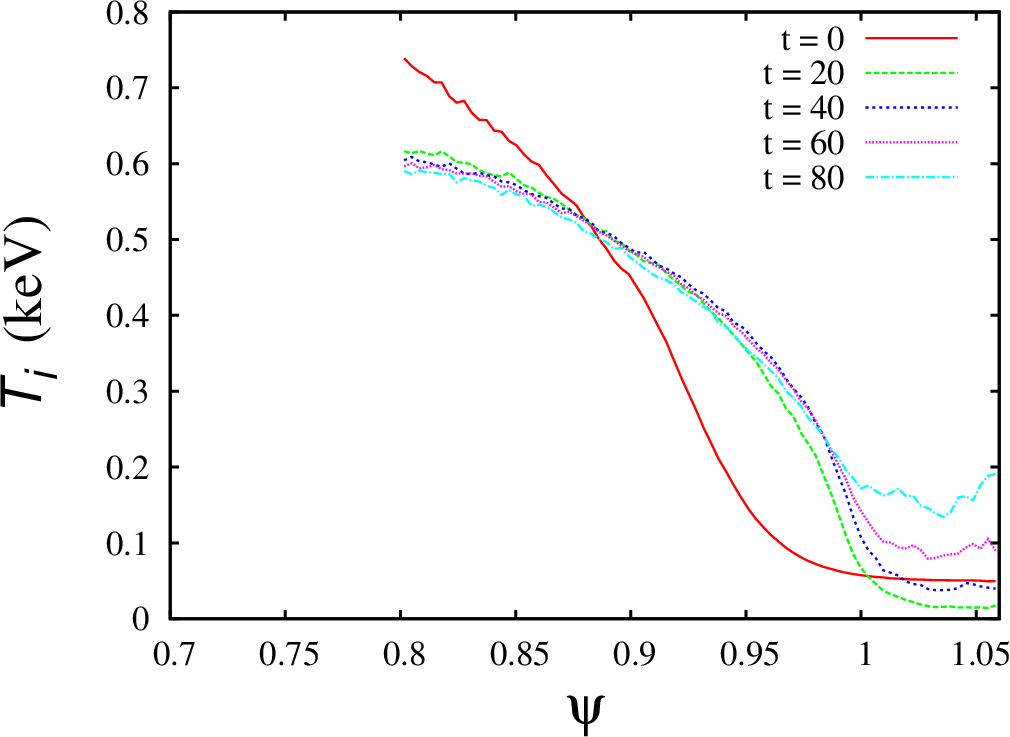
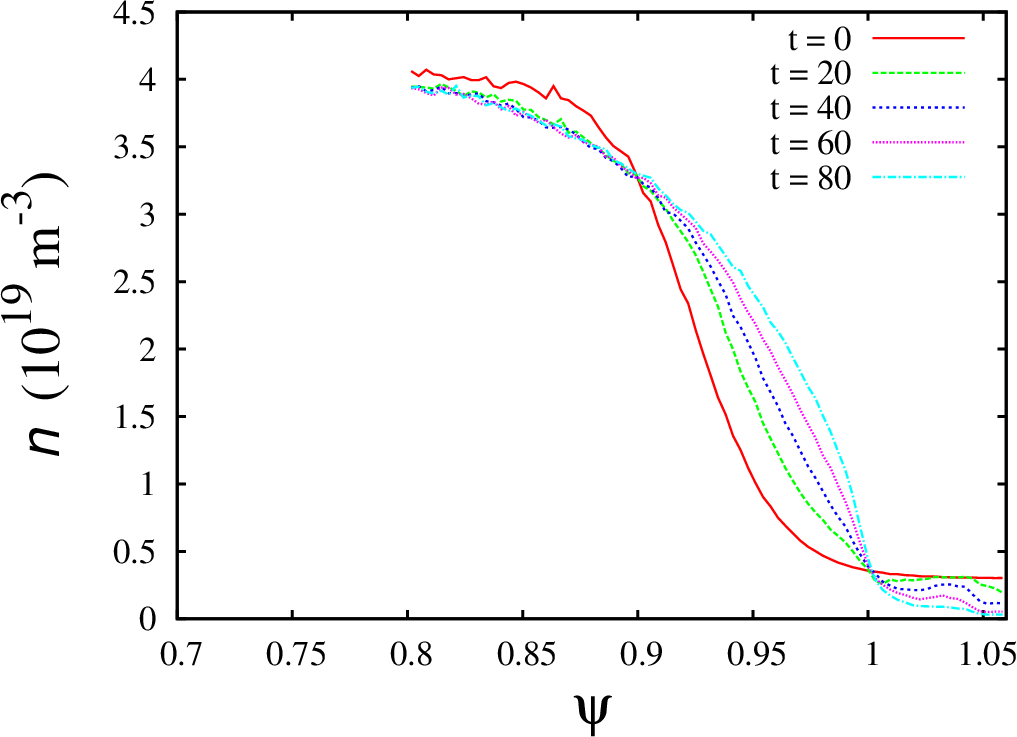
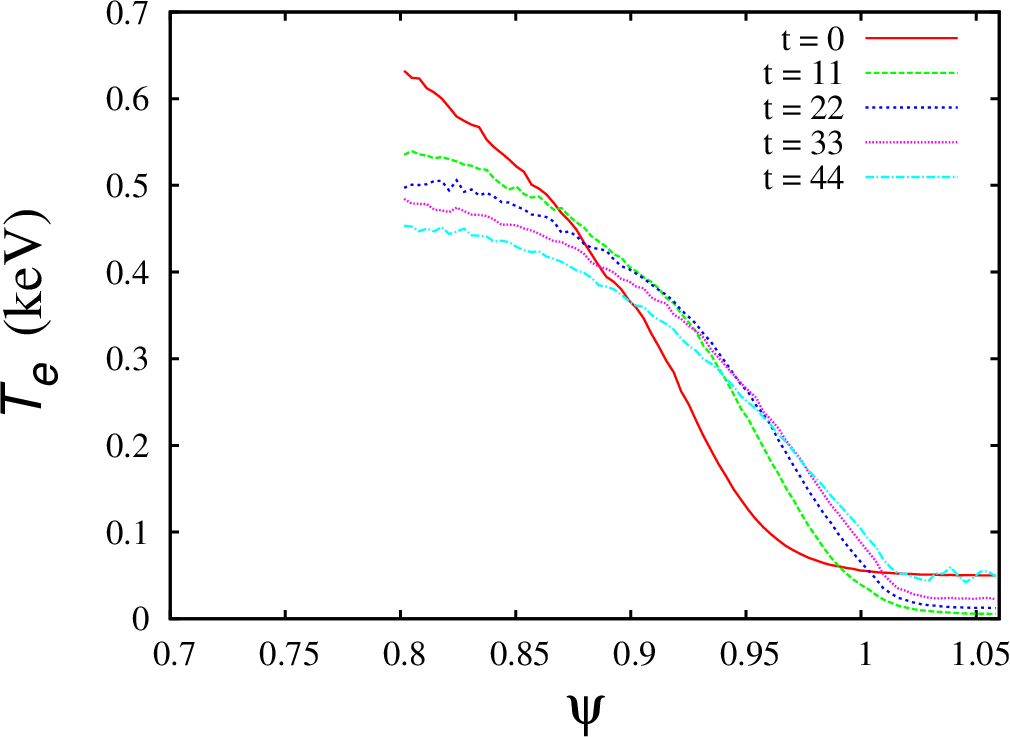
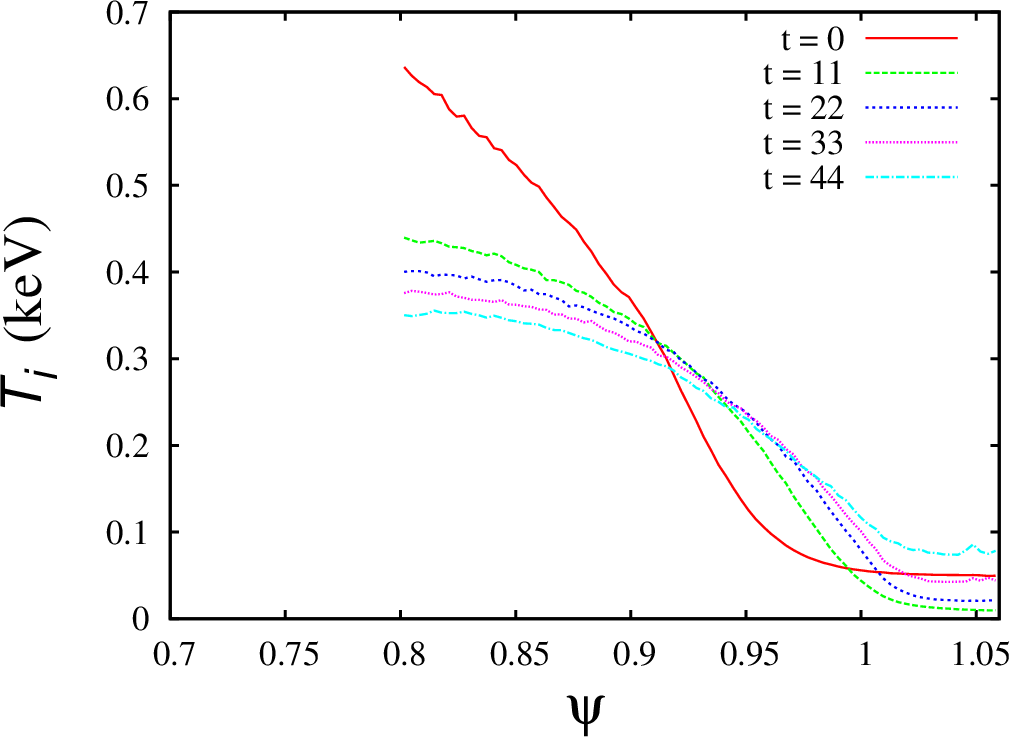
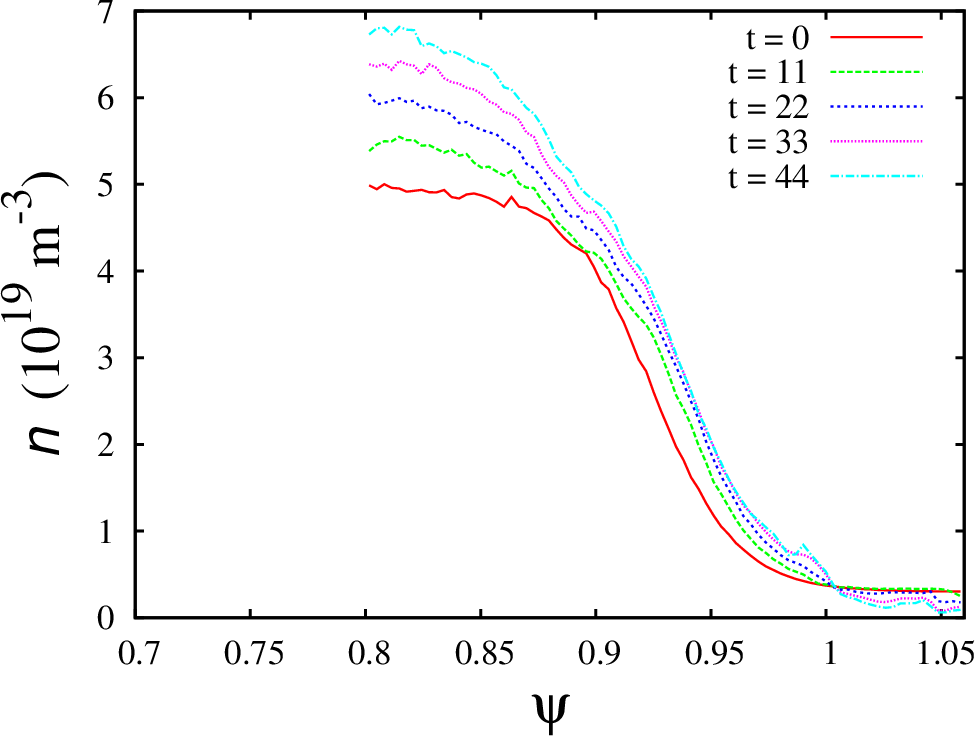
The electron and ion temperature profiles and electron density profiles for all four cases are given below.
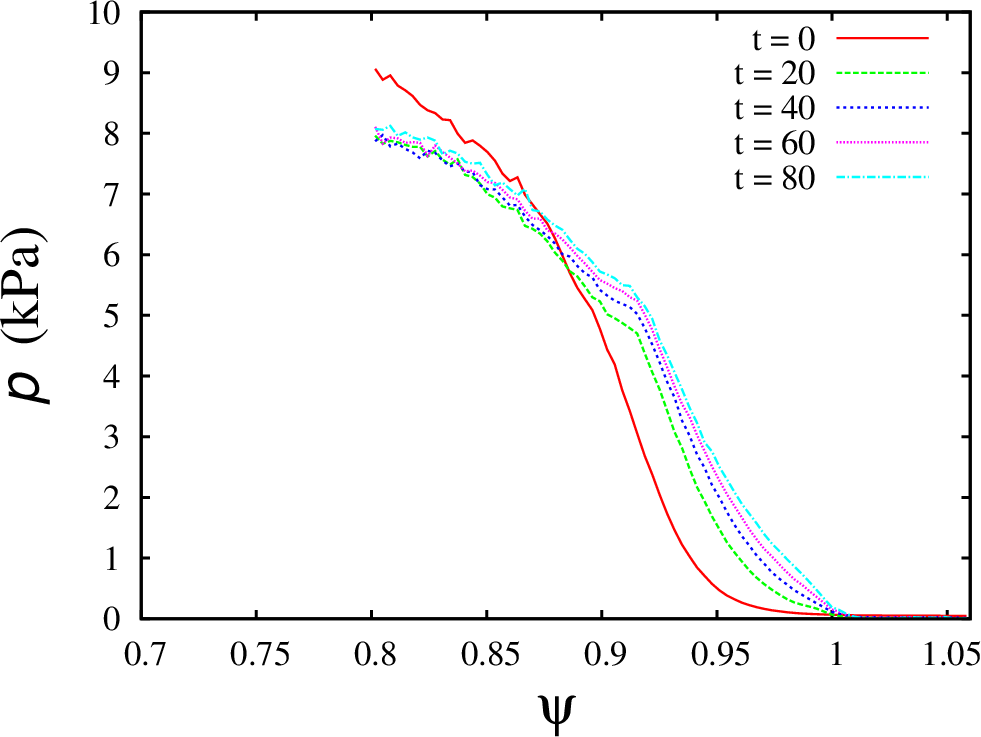
Case XGC-T85Y
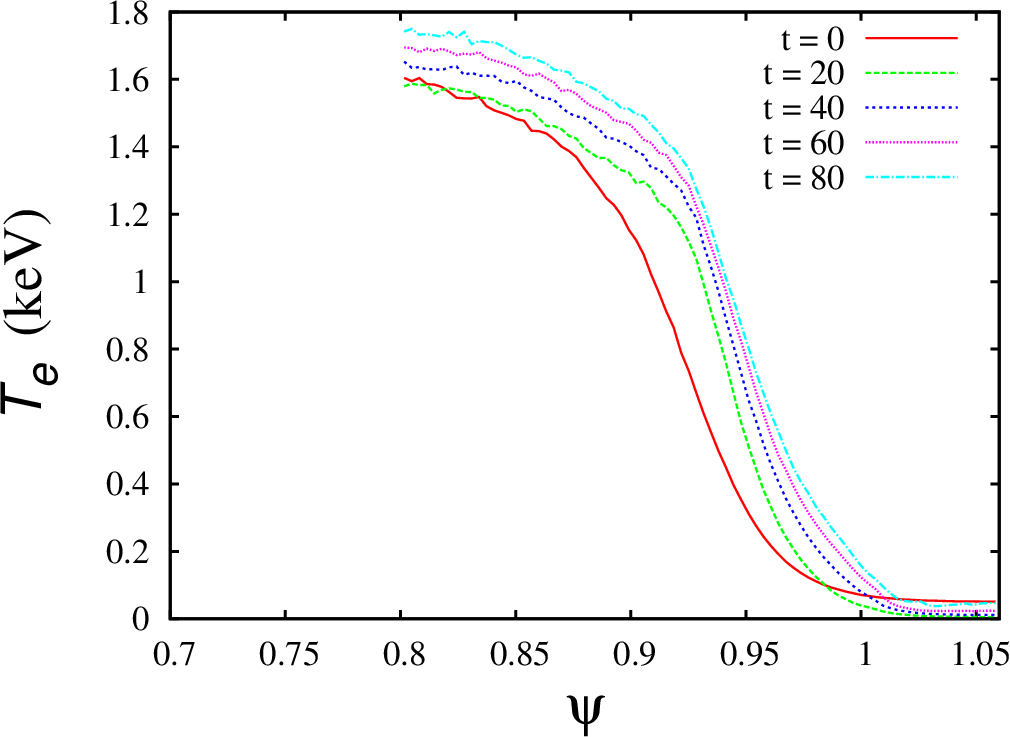 Electron temperature profile for the case XGC-T85Y |
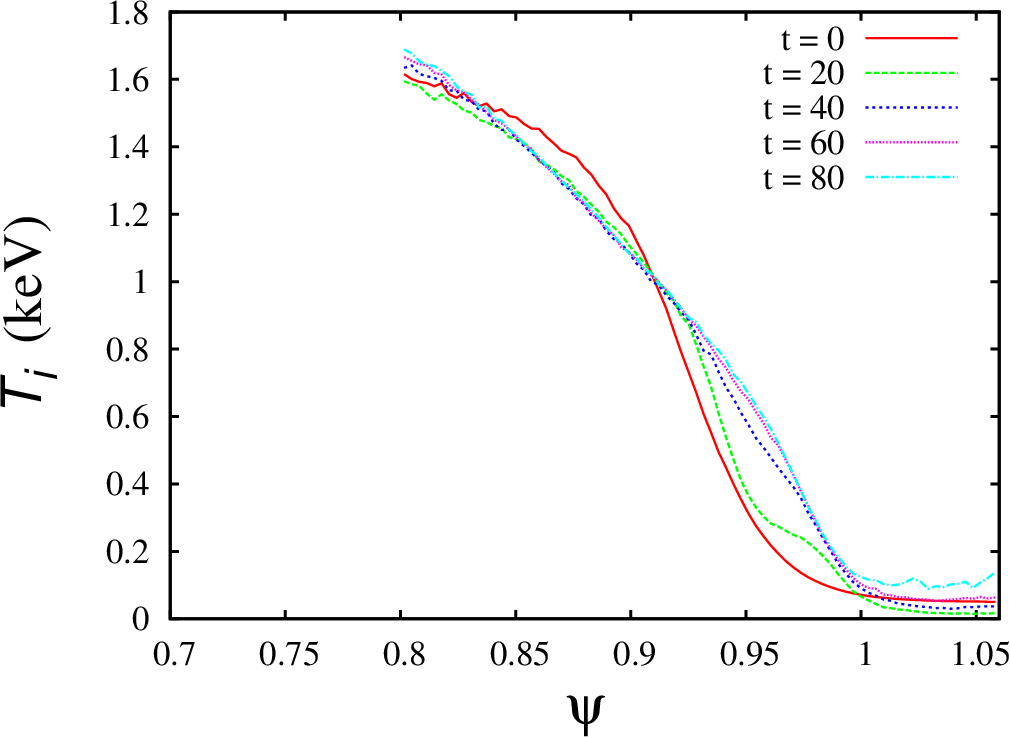 Ion temperature profile for the case XGC-T85Y |
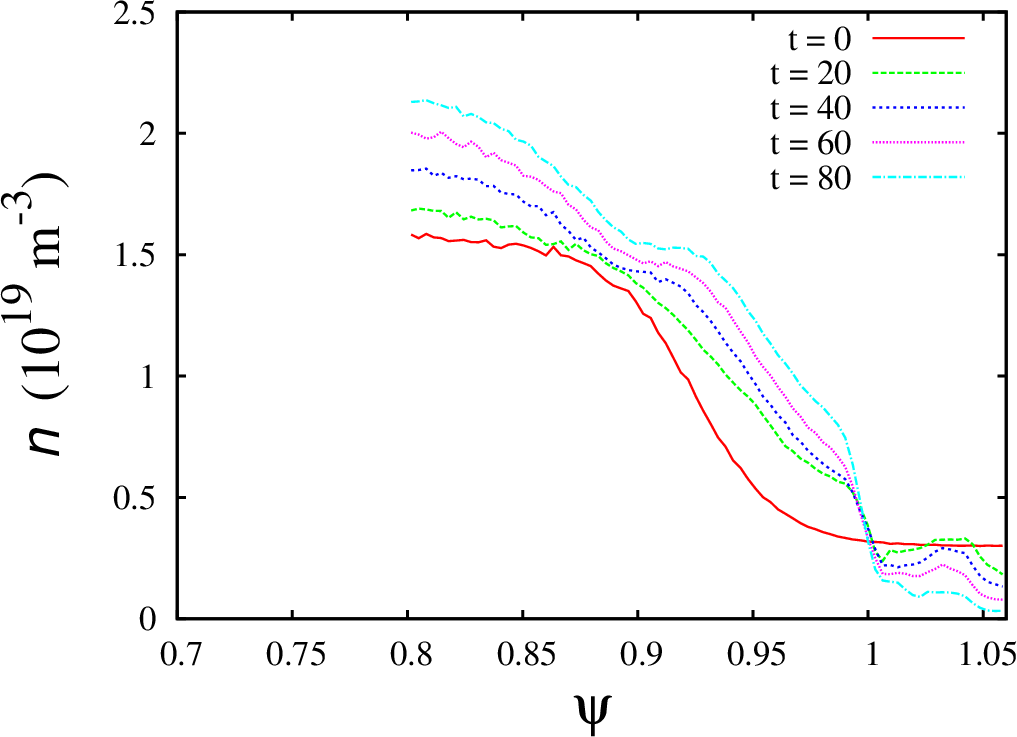 Electron density profile for the case XGC-T85Y |
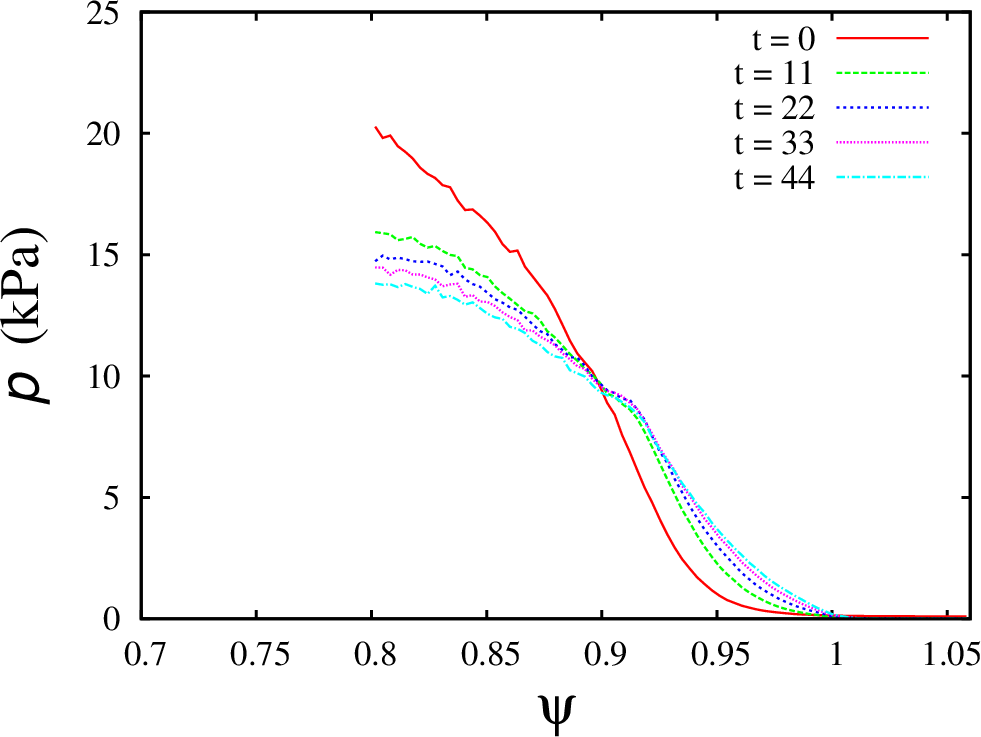
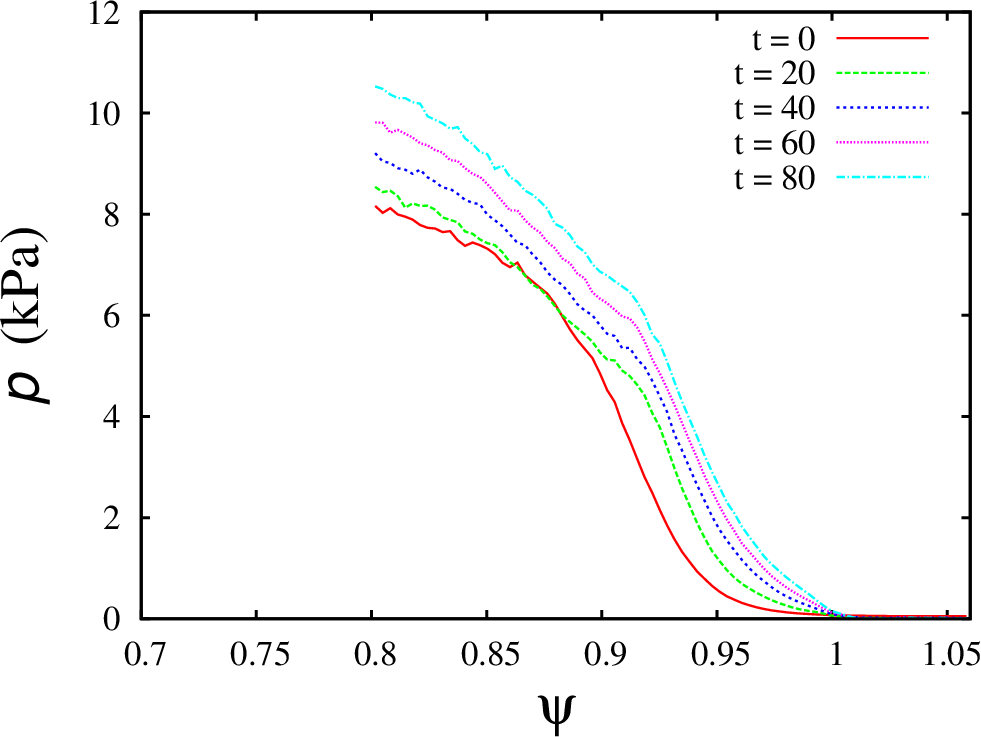 Plasma pressure profile for the case XGC-T85Y |
Case XGC-T86Y
 Electron temperature profile for the case XGC-T86Y |
 Ion temperature profile for the case XGC-T86Y |
 Electron density profile for the case XGC-T86Y |
 Plasma pressure profile for the case XGC-T86Y |
Case XGC-T87Y
 Electron temperature profile for the case XGC-T87Y |
 Ion temperature profile for the case XGC-T87Y |
 Electron density profile for the case XGC-T87Y |
 Plasma pressure profile for the case XGC-T87Y |
Case XGC-T88Y
 Electron temperature profile for the case XGC-T88Y |
 Ion temperature profile for the case XGC-T88Y |
 Electron density profile for the case XGC-T88Y |
Plasma pressure profile for the case XGC-T88Y |
Some observations:
- The pedestal width is smaller than the width that is used for the initial profiles. The computed pedestal width is around 0.6-0.7 of the normalized poloidal flux for all cases.
- During the XGC0 runs (44-80 ion transit times), the pedestal continue to grow only for the first two cases. The pedestal height decreases for two other cases. This effect is most notable for the last case, that has the largest collisionality. I had to increase internal particle source in this case in order to run it to 44 ion transit times. Event with increased particle sources, the simulations for the case XGC-T88Y crashes after 44 ion transit times.
- The slop of the plasma pressure profiles continue to change for all four cases.
- There is a density depletion in the SOL region for the second and third cases at t=80. This effect results in an artificial increase of ion temperatures in the SOL region.
Leave a Reply