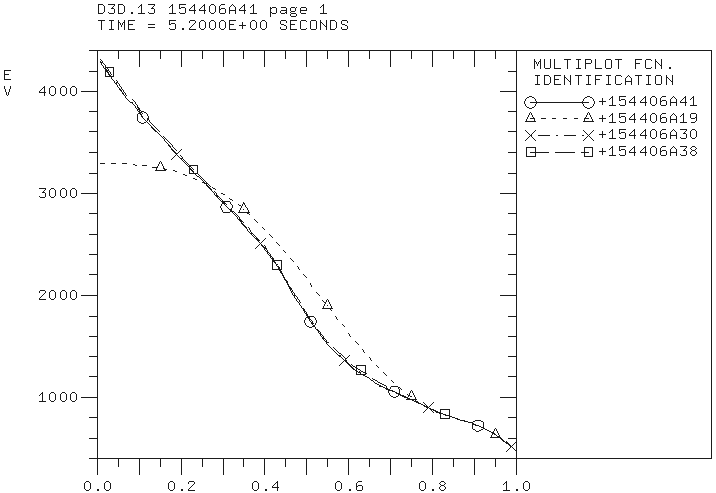
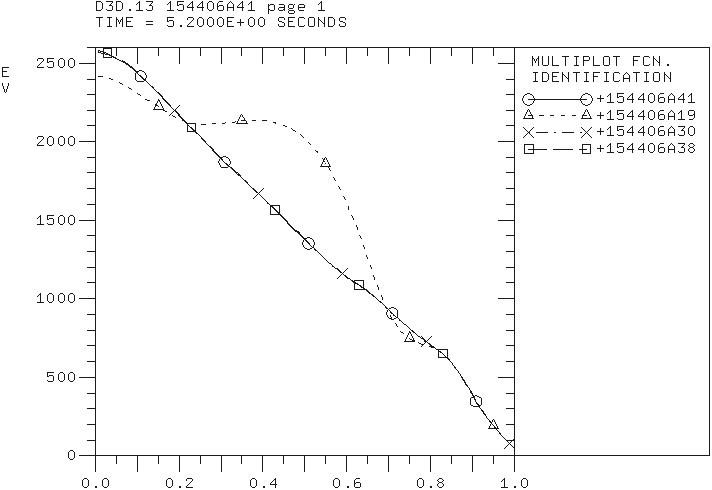
The role of the ExB flow shear on the predicted temperature profiles for the DIII-D discharge 154406 is investigated using the FACEXB scaling factor. I noticed a very small change in the predicted temperatures when this factor is set to 0 (154406A41), 1 (154406A30), and 2 (154406A38). Another simulation (154406A44) with the FACEXB factor set to 10 is also started.
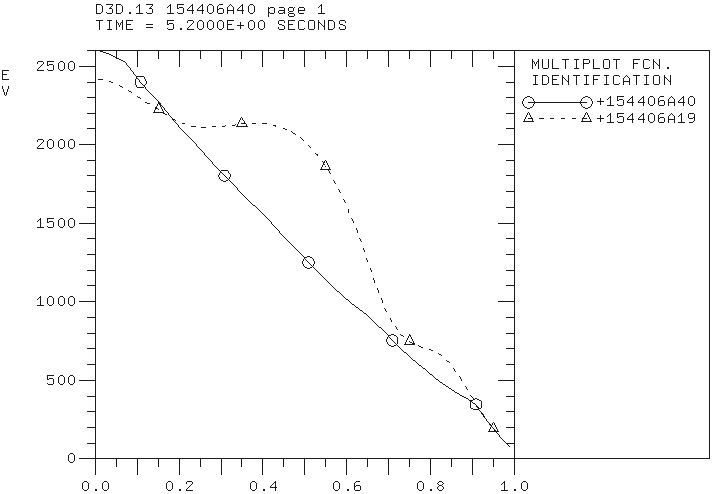
The boundary conditions have been moved from 0.8 to 0.9 in the simulation of the electron temperature profile for the DIII-D discharge 154406 (154406A40). The ion temperature is not evolved. The predicted temperature profile agree with the experimental profile at approximately the same level as in the simulation with the boundary condition set at 0.8 (154406A30).
The predicted electron temperature profile shown as a solid curve is compared with the experimental temperature profile shown as dashed curve.
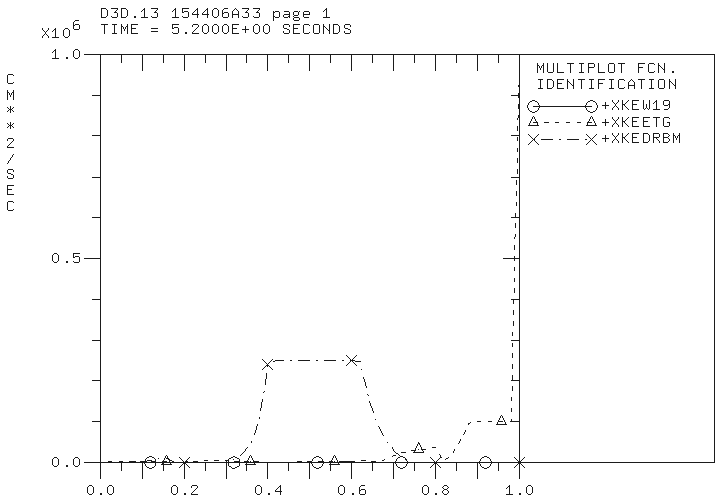
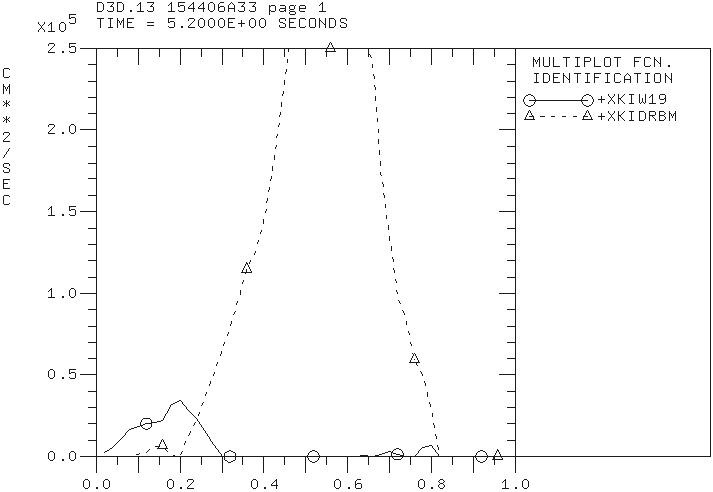
The drift resistive inertial ballooning modes (DRIBM) are destabilized by the density gradients. These modes are strongly stabilized by plasma temperatures. They are usually unstable in the plasma edge region close to the separatrix. The DRIBM modes are expected to be stable in the plasma core region of H-mode discharges. However, PTRANSP analysis of the DIII-D discharge 154406 shows that these modes are unstable in the region from 0.3 to 0.7 of normalized minor radius:
Effective electron (left) and ion (right) thermal diffusivities computed using the MMM7.1 model in the modeling of DIII-D discharge 154406 by the PTRANSP code.
The DRIBM model includes contributions from other MHD modes in addition to the drift resistive ballooning modes that can be unstable in this region. However, the validation of predicted temperature profiles hints that these modes are probably should be stable and DRIBM predicts significantly larger level of transport than expected. Additional validation of DRIBM is necessary. In particular, the effects associated with the large poloidal beta or large plasma currents such as Shafranov shift stabilization in DRIBM might need to be revisited.
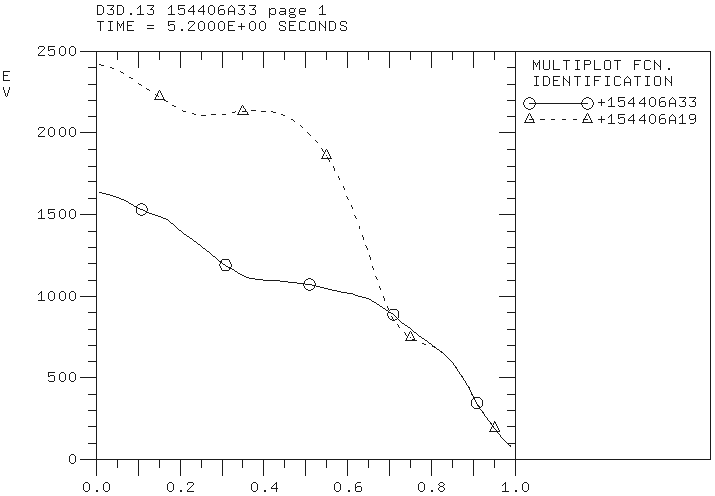
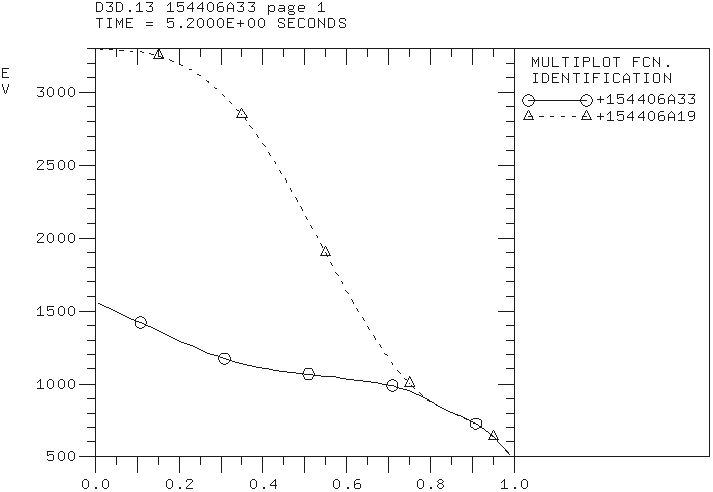
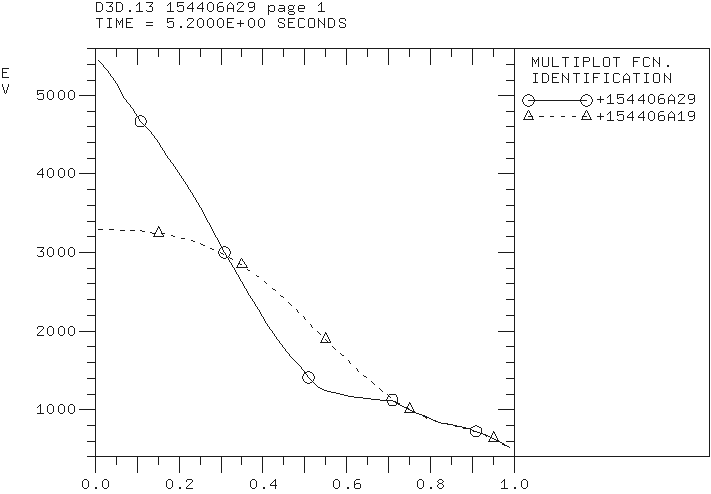
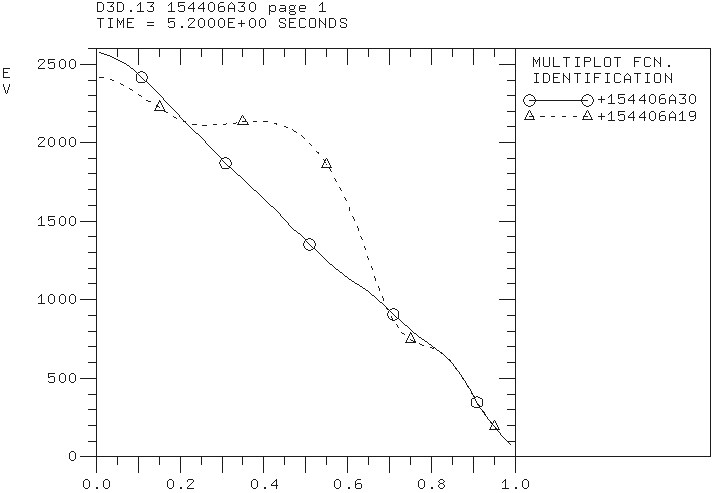
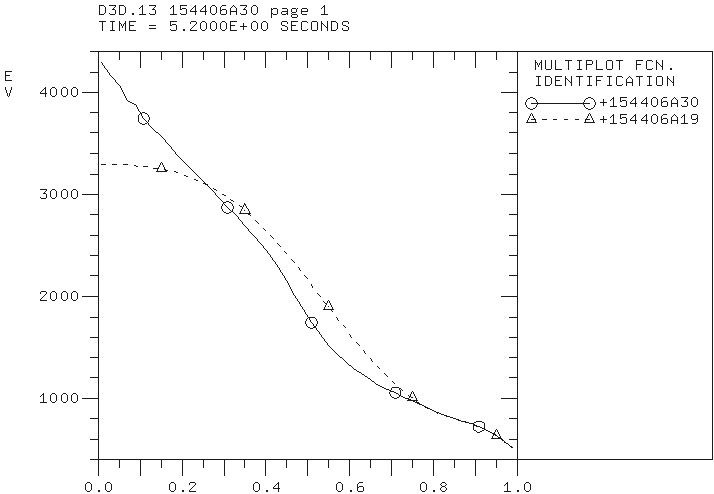
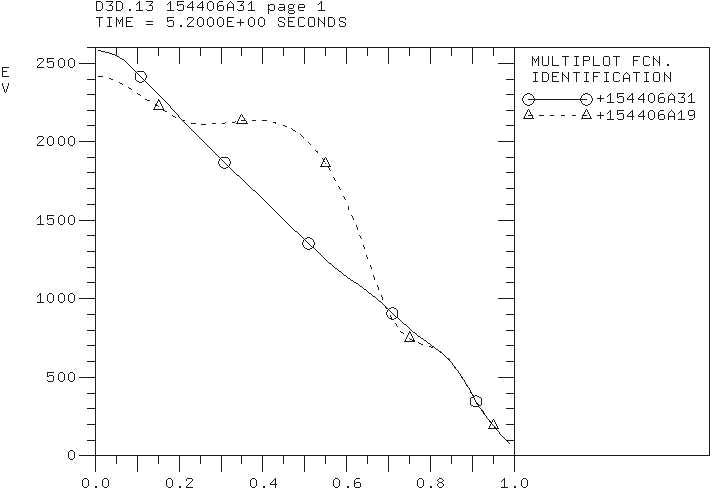
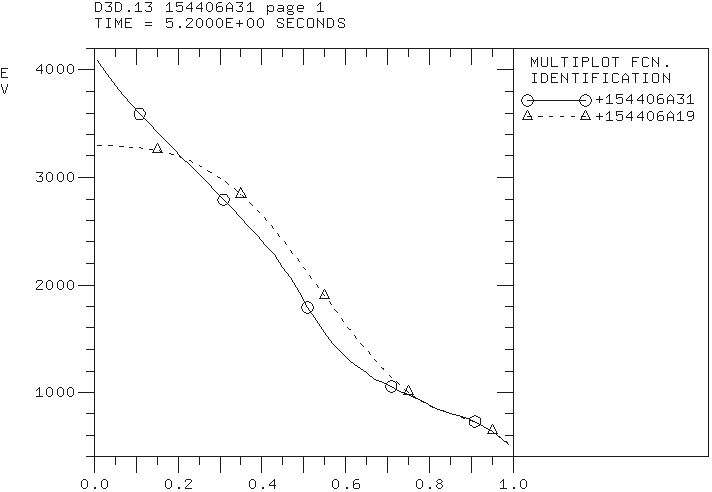
Predicted electron (left) and ion (right) temperature profiles in the PTRANSP simulation of the DIII-D discharge 154406 using the Weiland, ETG, and DRIBM components of the MMM7.1 model.
The temperature profiles are predicted using the Weiland and ETG components of the Muti-Mode Model (MMM7.1). The predicted temperature profiles are compared with the corresponding temperatures from interpretive simulations (154406A19). Four PTRANSP simulations are completed. These simulations are: (1) Only electron temperature is evolved (154406A28); (2) Only ion temperature is evolved (154406A29); (3) Electron and ion temperatures are evolved (154406A30); and (4) Electron and ion temperature as well as toroidal momentum are evolved (154406A31).
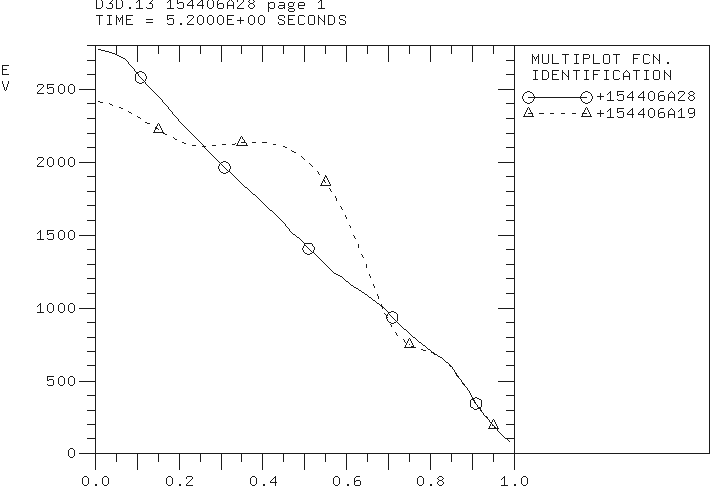
The electron temperature profile in the PTRANSP simulation 154406A28.
The ion temperature profile predicted in the PTRANSP simulation 154406A29.
The electron (left) and ion (right) temperature profiles predicted in the PTRANSP simulation 154406A30.
The electron (left) and ion (right) temperature profiles predicted in the PTRANSP simulation 154406A31.
It is somewhat unexpected that a that better agreement between predicted and experimental profiles is found in the simulations in which the electron and ion temperatures are evolved simultaneously. Neither simulation can accurately reproduce the location of internal transport barrier in the electron temperature profile. The reason is a rather significant electron thermal transport from both the Weiland component (TEM and ITG modes) and ETG component of MMM7.1 that destroys ITB from strong off-axis ECR heating.
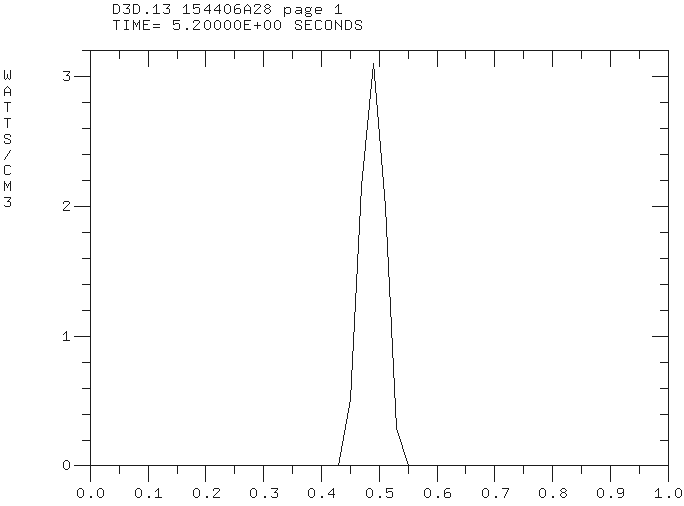
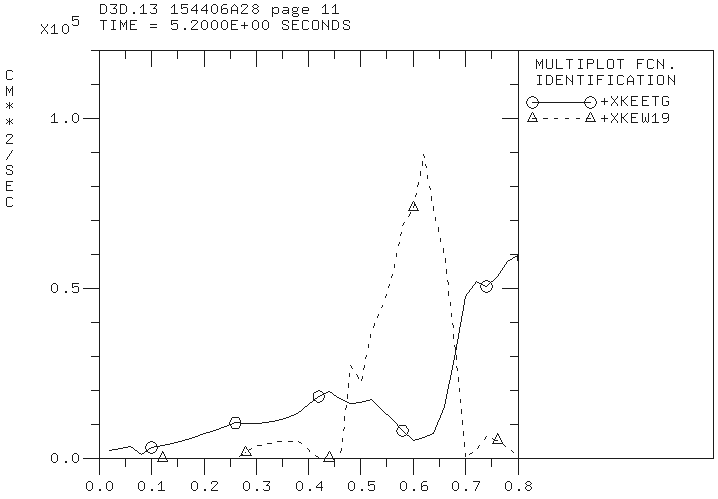
The ECR heating profile (left) and electron thermal effective diffusivities (right) computed in the Weiland and ETG components of MMM7.1 in the predictive PTRANSP simulation 154406A28.
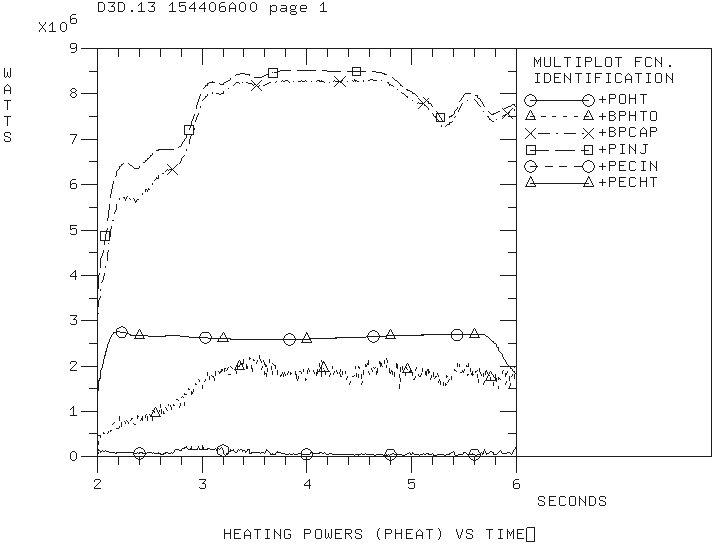
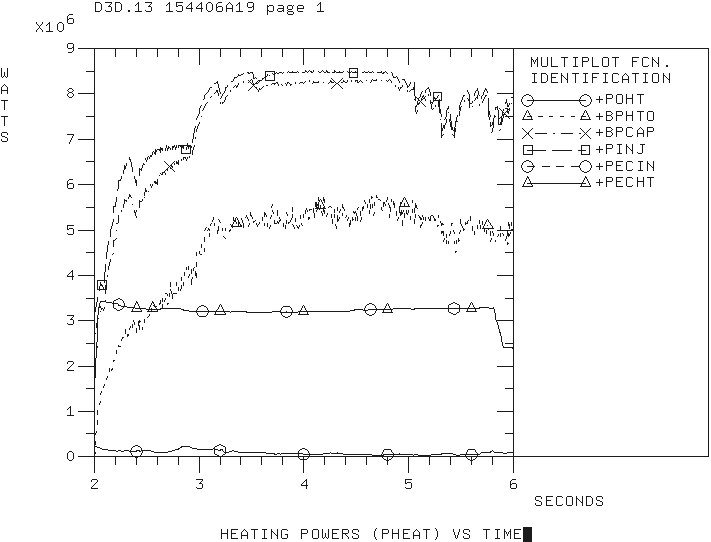
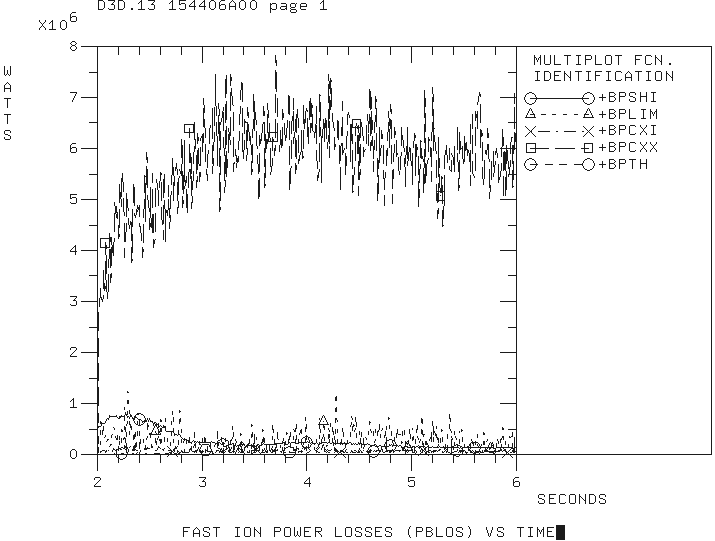
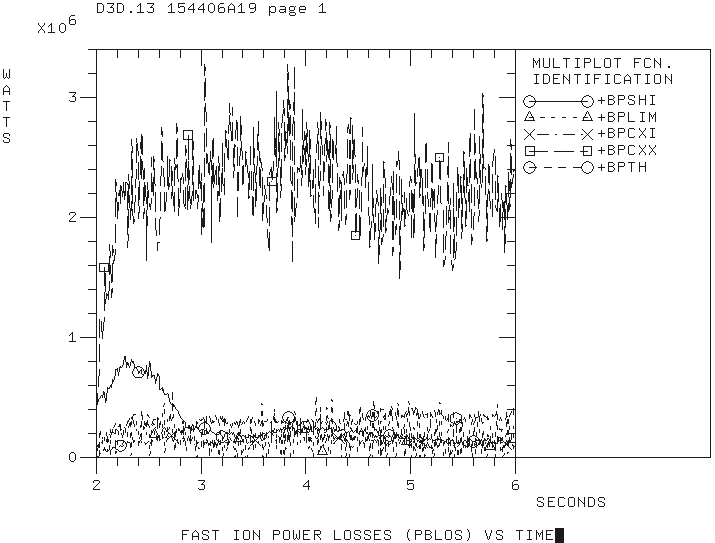
The TRANSP code is used to simulated the high poloidal beta DIII-D discharge 154406. Previous simulations that were presented by Andrea Garofalo at the TTF meeting (April 28-May 1, 2015; Salem, MA) and the H-mode workshop (October, 2015; Garching, Germany) includes the results obtained by Gary Staebler and Brian Grierson using the GLF23 and TGLF models. The ion thermal transport is found close to the neoclassical level. The electron temperature is found to be over-predicted. My new TRANSP simulations are started from the existing TRANSP run 154406R04 on the PPPL cluster. A number of simulations using various MMM7.1 parameters are performed. Both electron and ion temperatures are found to be strongly under-predicted. I have also generated new TRANSP input files using AUTOTRANSP. Some NUBEAM and ECH parameters are found different from the corresponding parameters in the 154406R04TR.DAT file. These differences resulted in significant differences in the total fast ion heating BPHTO which is related to anomalously large outside CX losses BPCXX in the simulations that are based on the run 154406R04.
Input heating powers in the simulation that is based on input from the 154406R04 input (left) and autotransp (right).
Beam losses in the simulation that is based on the 154406R04 input (left) and autotransp (right).
New options for better domain decompositions is based on the Fftw3 library. It is used when nphi in nimrod.in is more than 1 and when the FFTW3 library is compiled with NIMROD.
This library needs to be manually enabled during the NIMROD compilation. The following line needs to be added to nimdevel serial and parallel config scripts:
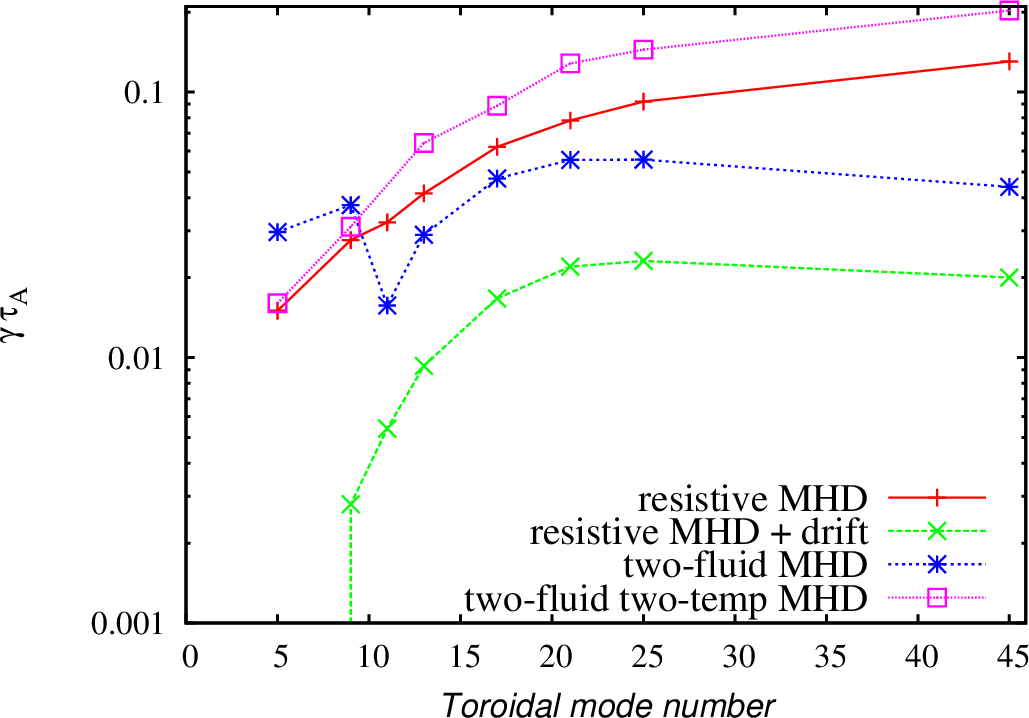
In order to identify minimum MHD model sufficient for nonlinear MHD analysis of KSTAR discharges, the following models in the NIMROD code were considered:
Resistive MHD
Lundquist number
The Spitzer resistivity is used
No parallel viscosity or gyro-viscosity
No particle diffusivity, hyper-diffusivity or hyper-resistivity
Resistive MHD with drifts
Parallel viscosity and gyro-viscosity are enabled
Particle diffusivity is enabled
No hyper-diffusivity
Two-fluid MHD
Two-fluid two-temperature MHD
Equilibria generated for the BOUT++ stability analysis and provided by Minwoo have used in this NIMROD analysis.
The simulation results below are given for the equilibriun number #3 from the set of equilibria obtained from Minwoo Kim on August 31. The NIMROD grid in these simulation is 72×512 with polynomial degree of 6.
Normalized growth rates as functions of toroidal mode numbers.
The spectrum of the most unstable toroidal modes is different comparing to the predictions produced by Minwoo using the BOUT++ code. The ELM model that Minwoo uses in his simulations is somewhat similar to the restive MHD model with drifts in the NIMROD code. The NIMROD results are very moderately peaked around n=20-30, while the BOUT++ results showed the pecking for lower toroidal mode numbers. The two fluid results in NIMROD show better peaking for n=20-25. However, the modes remain rather unstable for n=45. The nonlinear simulations that would include first 45 toroidal modes might still be underresolved. For the two-fluid nonlinear NIMROD simulations, it is better to select equilibrium with the pressure profiles somewhat more relaxed in the H-mode pedestal region and with the larger bootstrap fraction so that lower n modes are more unstable.
The eigenmode structure for low- and high- toroidal mode numbers are found different in the two fluid simulations. The unstable lower toroidal mode numbers are found to be localized in the high filed side region, while the higher toroidal mode numbers are found to have more ballooning like nature. The transition between these two distinguishably different regions is found around n=9.
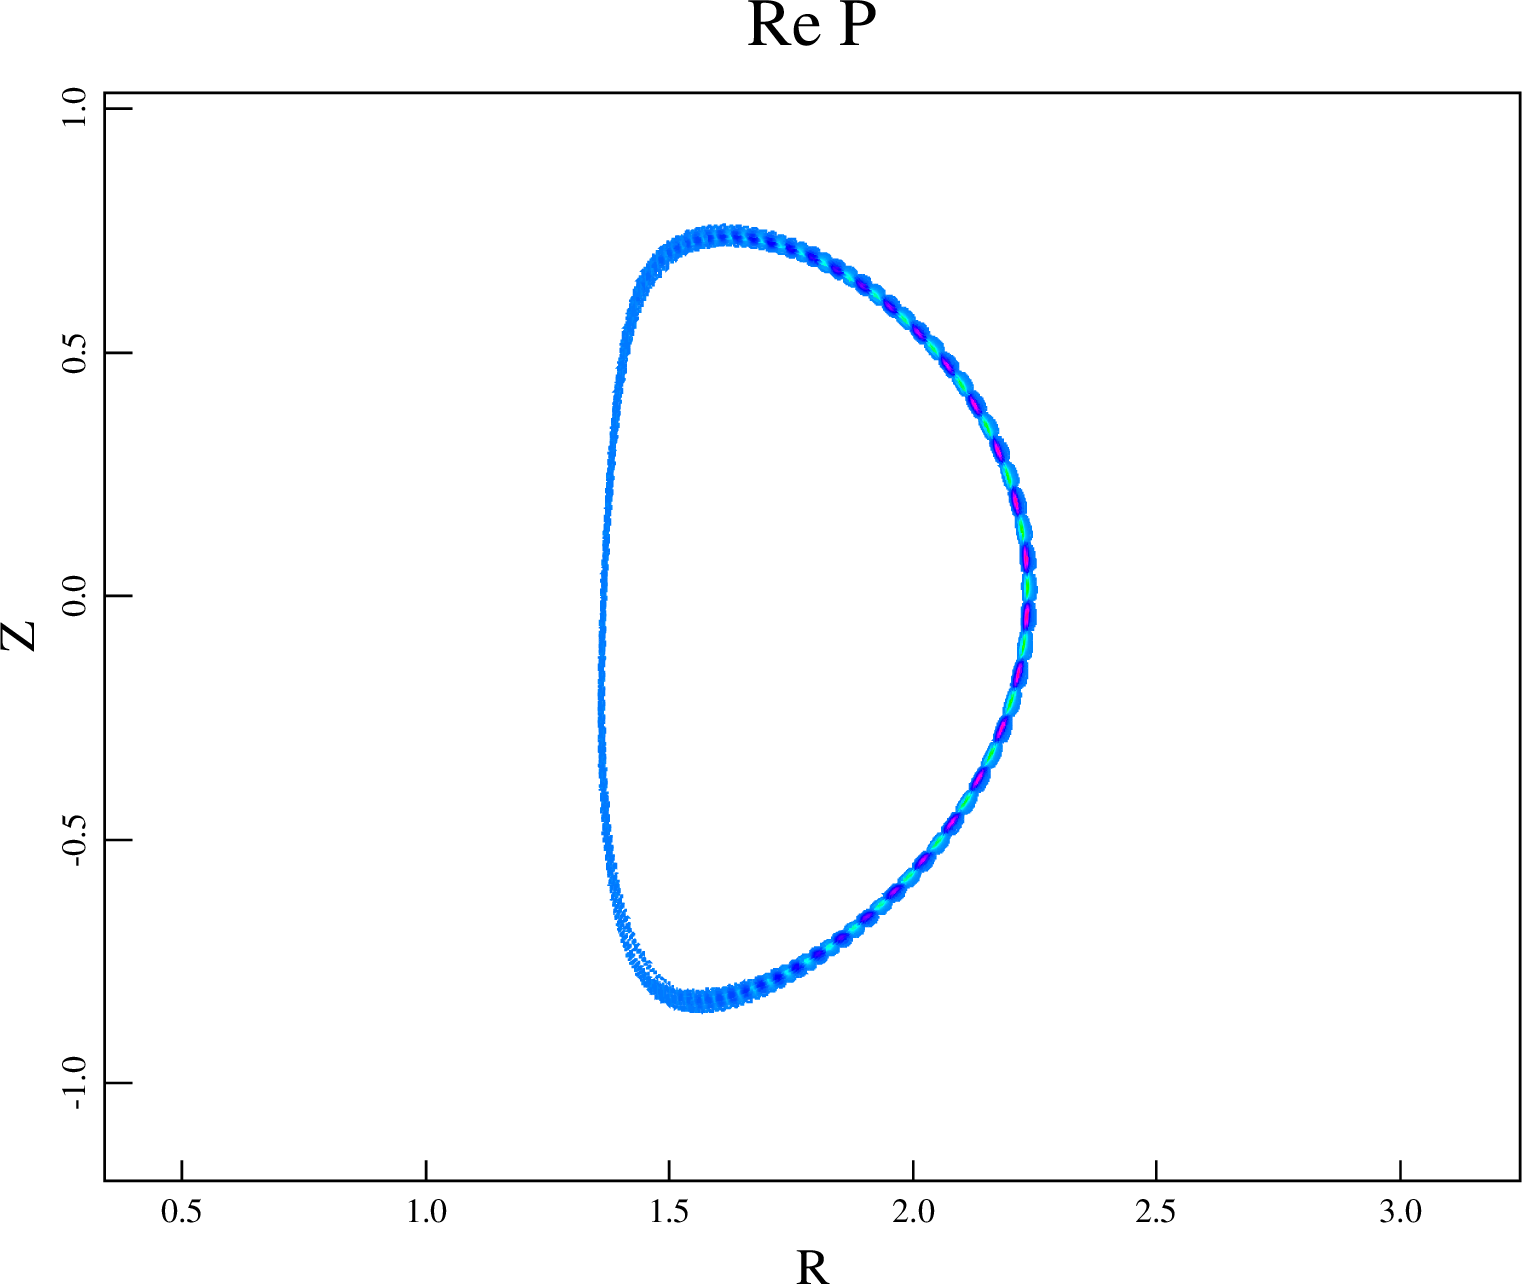
Mode structure for n=5
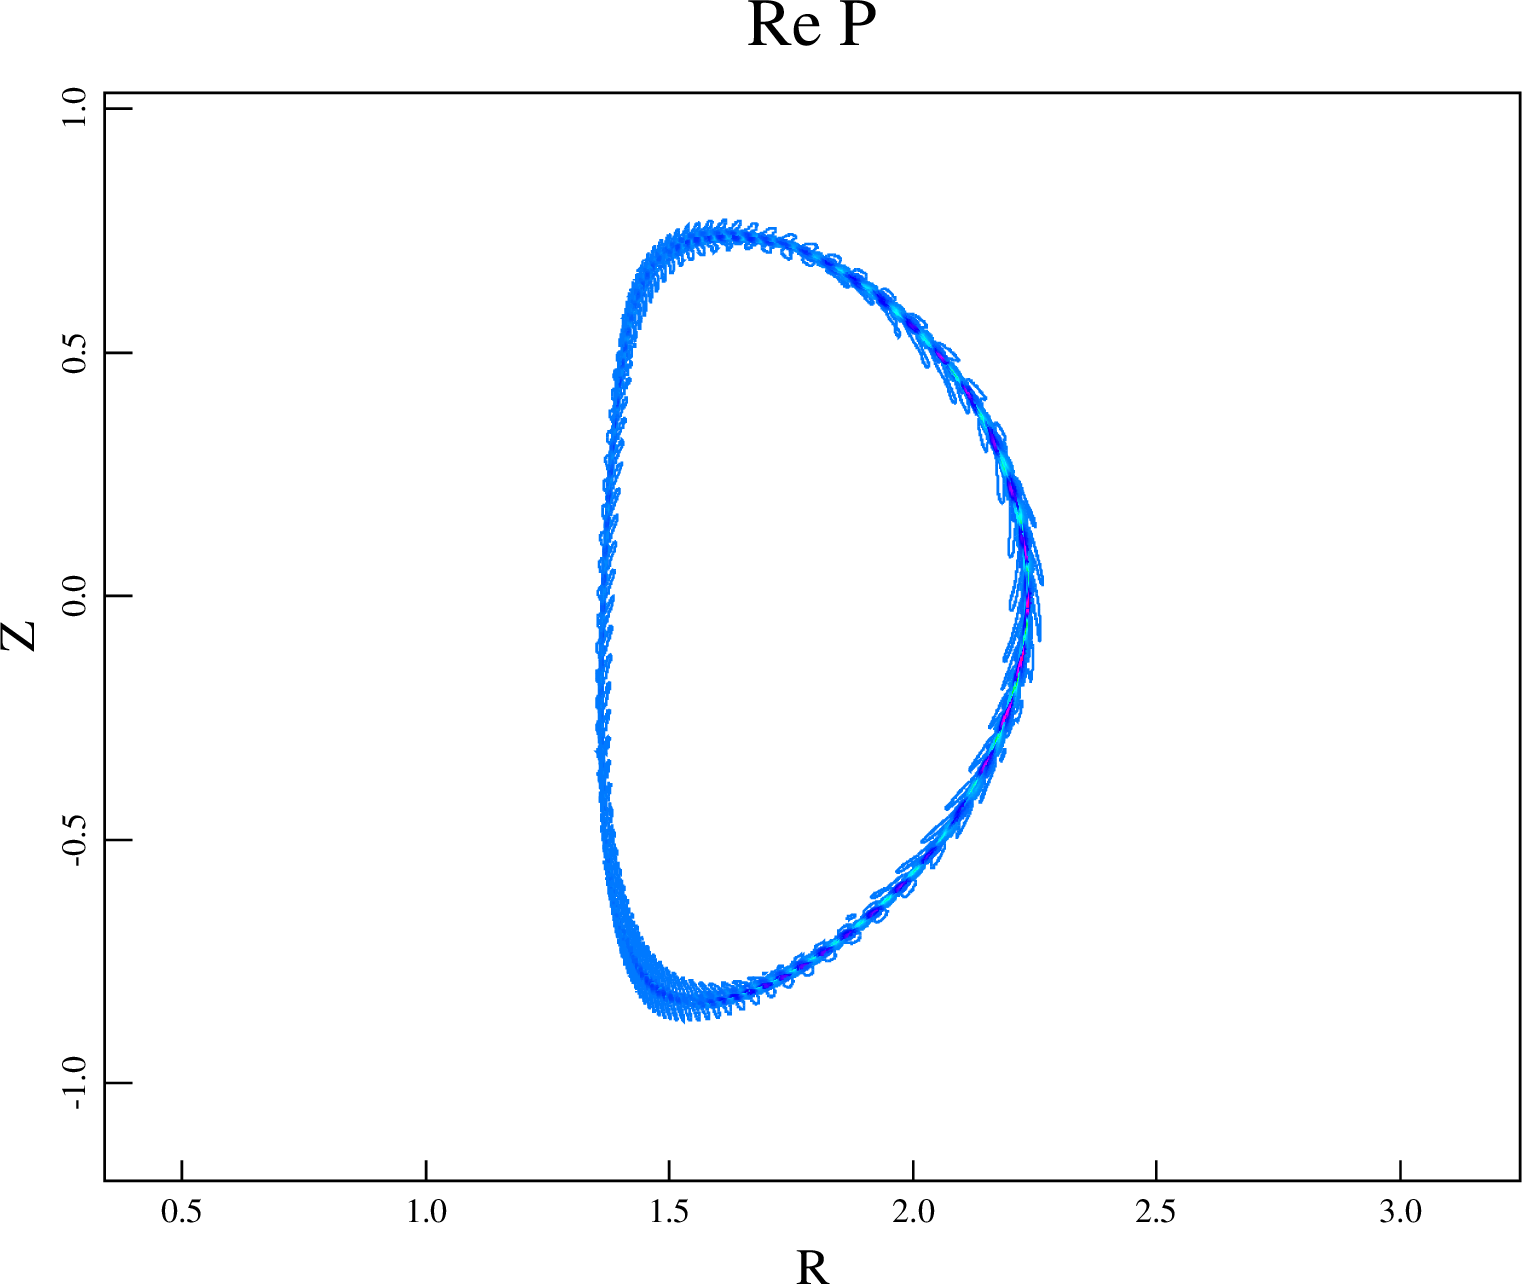
Mode structure for n=17.
The inclusion of two-temperature effects is found to affect the mode sprectrum and mode structure. The toroidal mode number of the most unstable modes is larger than the maximum toroidal mode number investigated in this study.
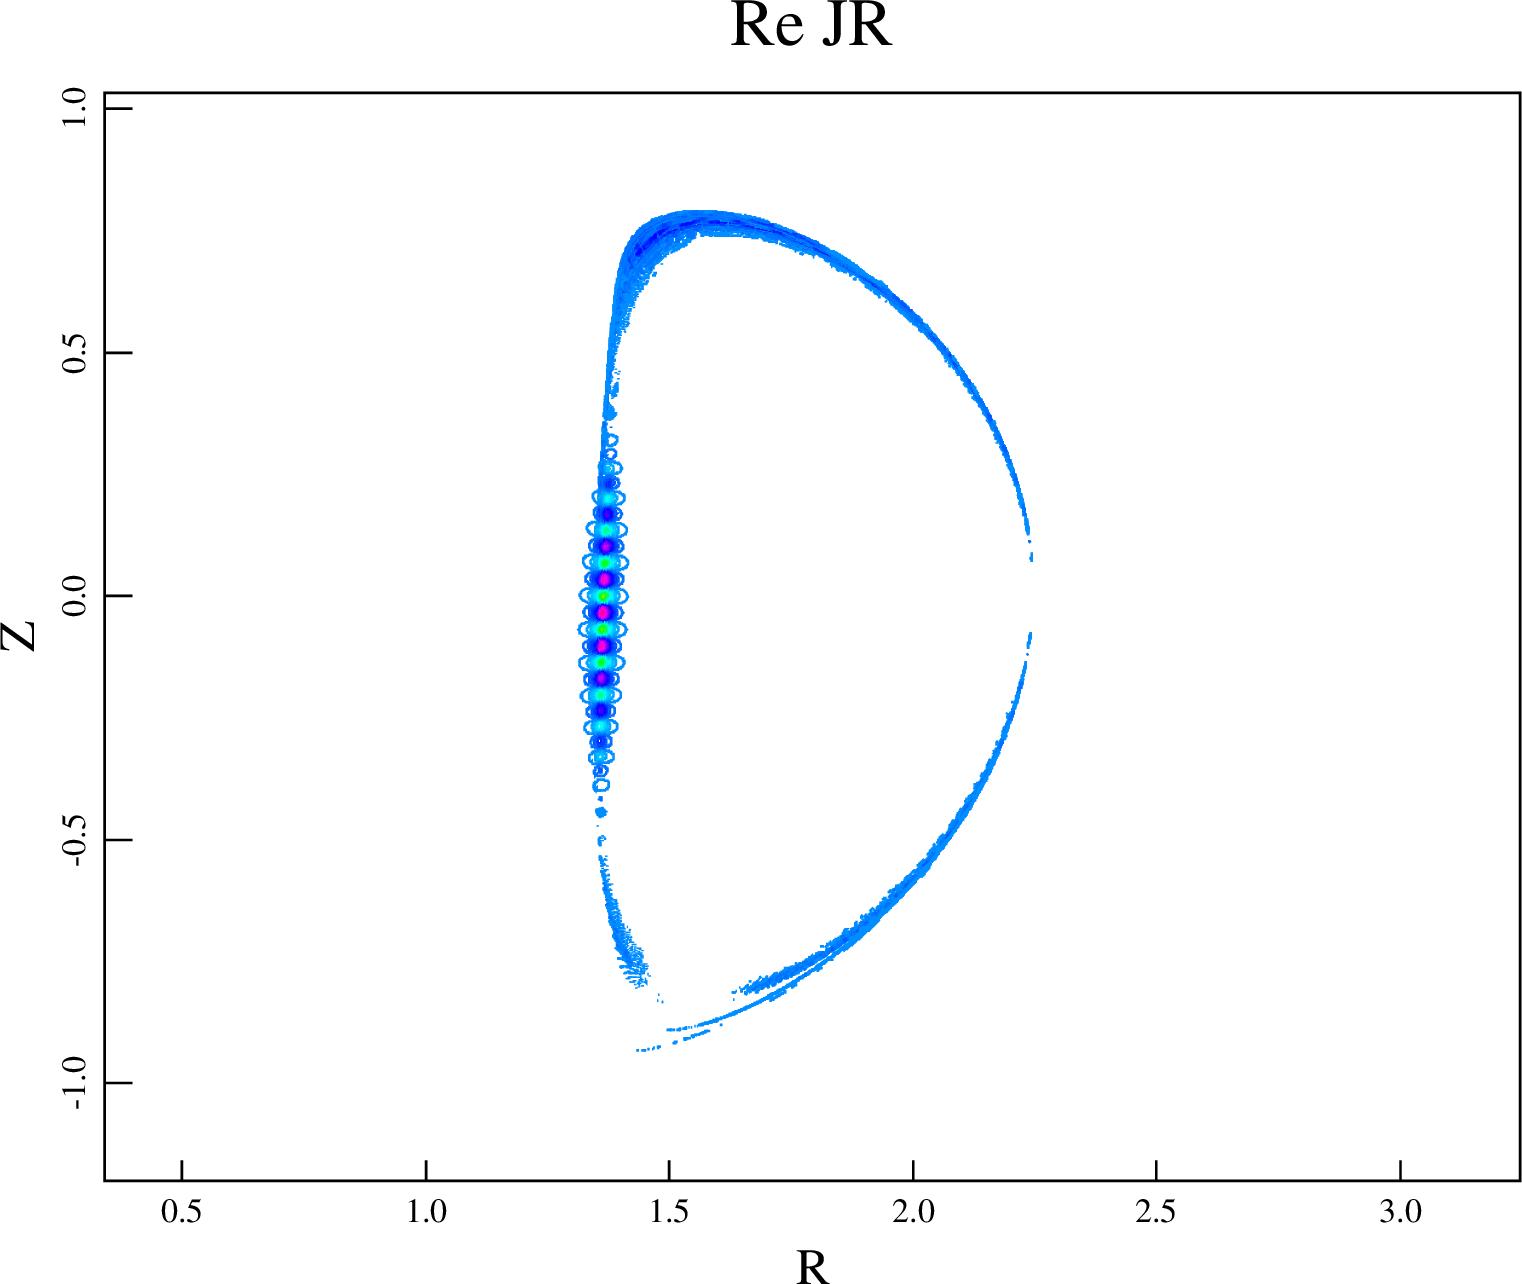
Pressure perturbations for n=17 found in the two-fluid NIMROD simulation.
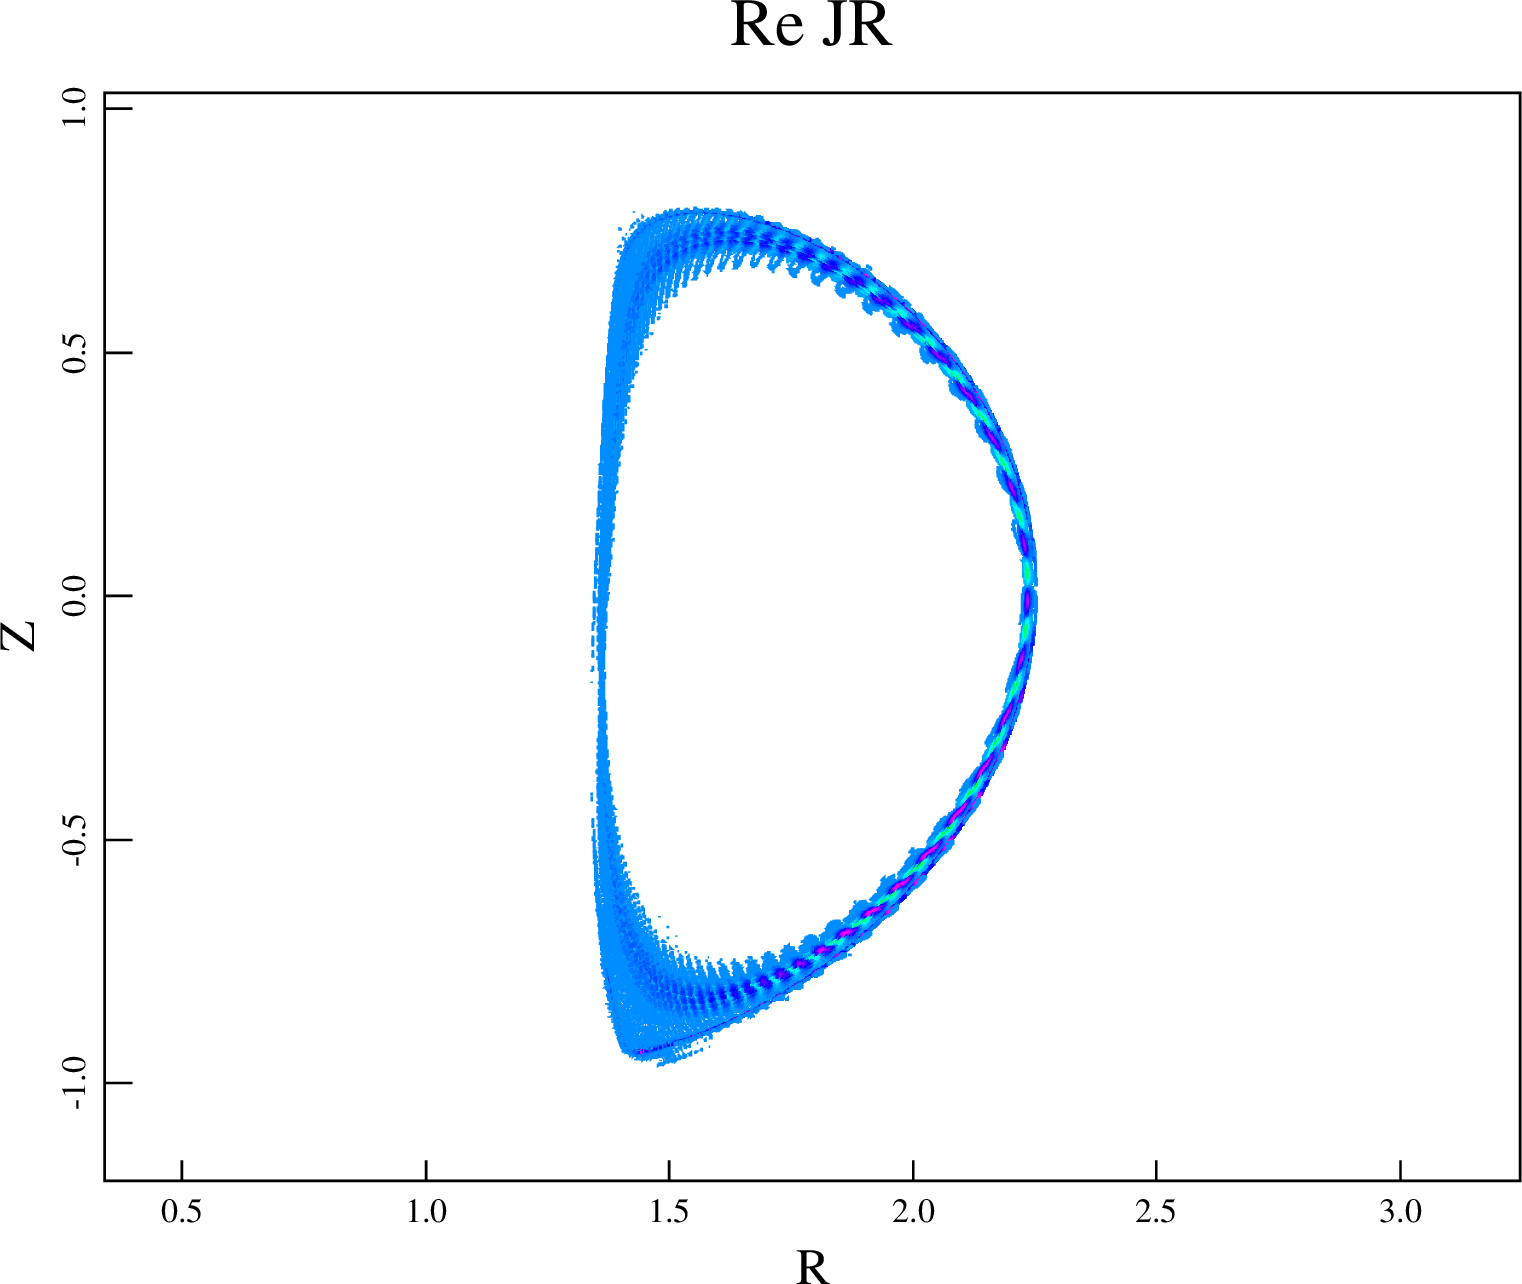
Pressure perturbations for n=17 found in the two-temperature two-fluid NIMROD simulation.
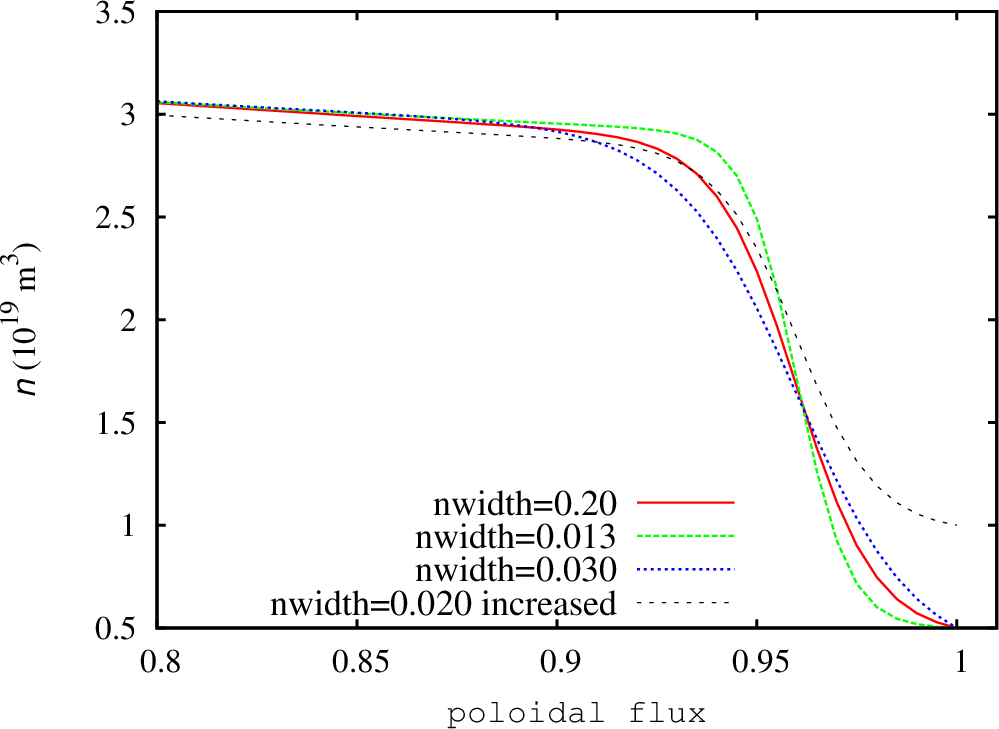
The modes found in the two-temperature NIMROD simulations are sight more shifted towards the pedestal top comparing to the modes found in the two-fluid simulations. It looks like that the inclusion of two-temperature effects destabilizes a different types of modes comparing to the modes found in the two-fluid simulations. In order to investigate the properties of these modes, the density profiles in the original equilibrium has been altered so that the density gradient in the pedestal region has been changed. The pressure profile is not affected by this change. The density width has been changed from 0.013 to 0.03 in this scan. In addition, the density at the separatrix has been increased to investigate how this change will effect the growth rates in two-temperature two-fluid simulations. Note that the resistivity in the density width scan remains modestly affected. However, the resistivity in the simulation with the increased separatrix density is strongly effected because the separatrix temperature has been reduced to keep the pressure profiles unchanged.
Pedestal density profiles.
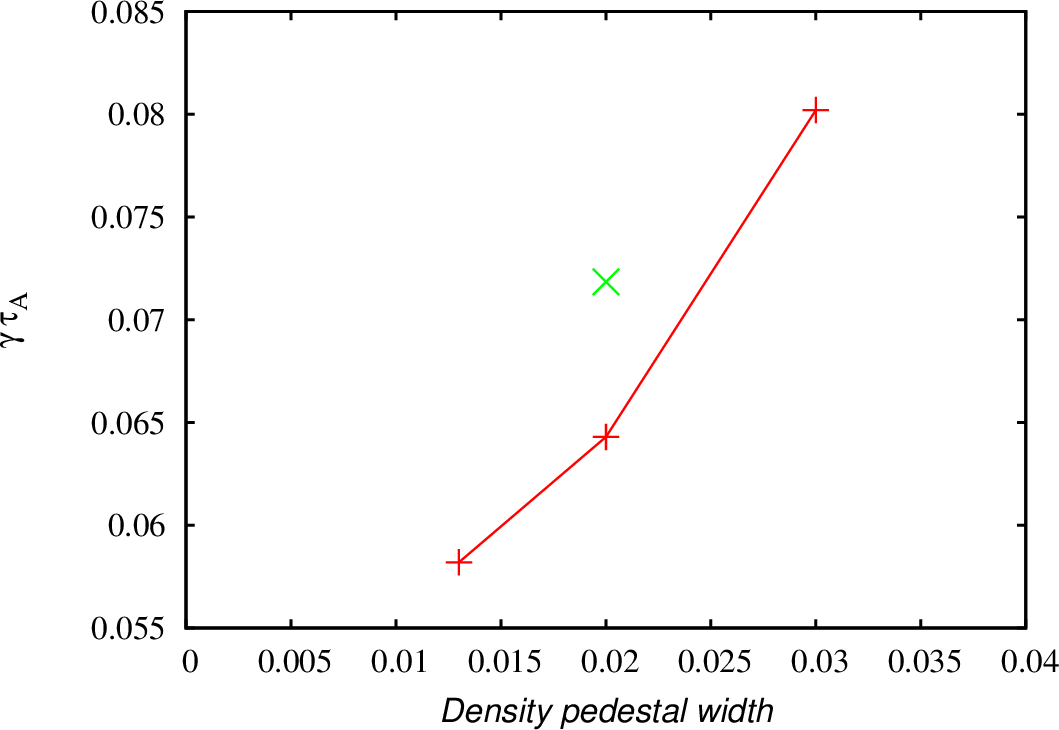
The growth rates for the first three cases are found comparable to each other in the resistive MHD and two-fluid simulations. The growth rates for the fourth case are found significantly larger than the growth rates in three other cases in the resistive MHD NIMROD simulations. It is also found that the the increased density gradient result in lower growth rates in the two-temperature NIMROD simulations. Such behavior is typical for ITG modes that are destabilized when the ratio of temperature gradient to the density gradient is increased.
Minwoo has tested the equilibrium reconstruction procedure described in this post. He has noticed that the q-profile changes significantly when the direct solution is reconstructed from the inverse solution by the TEQ code. I can reproduce the Minwoo observations and confirm that the whole q-profile shifts by about 10% when the direct equilibrium is generated from the inverse equilibrium. It might be useful if the TEQ developers can address this problem. Meantime, I have modified the equilibrium reconstruction procedure to avoid the problem with the q-profile. In the modified procedure, we postpone the generation of the direct equilibrium until very last step:
Start with the original sav-file for this discharge:
real ndens=psibar; ndens=2.6e19
real prbs=psave/10./2.
real tebs=prbs/ndens/1.602e-19
real zeffbs=psave; zeffbs=1.
real pbeambs=psibar; pbeambs=0.
read jbootstrap.bas
real jbs1 = jbootstrap(prbs,ndens,tebs,tebs,zeffbs, pbeambs, 1., 1., 0.)
real jbs0 = jbs1(:,1)
real foo1=tanh((1.01-psibar)/0.05)
real foo2=(1+tanh((psibar-0.7)/0.05))/2.
jparsave=jparsave*foo1+jbs0/bsqrf*foo2
Run a sequence of inverse and direct equilibrium solvers ensuring the the plasma current does not change:
Increase the resolution in the direct equilibrium solution to 257×257 (at least):
gridup; run; saveq("s13-t00-04.sav")
gridup; run; saveq("s13-t00-05.sav")
Save the new geqdsk file
weqdsk
In the plasma core region, the q-profile is not affected now. In the plasma edge region, the q-profile is modified. However, these changes are consistent with the bootstrap current model. It looks that the bootstrap current fractions computed in TEQ and TOQ does not agree well. In order to reproduce the TOQ bootstrap current, a scaling factor for the parallel current density is needed.
An important progress in the understanding of the pedestal structure in the KSTAR discharge 7328 has been made during my visit. In particular:
A new procedure to generate free boundary equilibrium for KSTAR discharges has been developed. This procedure is documented and is available online.
The improvements of the new equilibrium includes the following:
The (R,Z) resolution has been increased by a factor of four. The stability analysis as well as extended MHD studies require well-resolved equilibrium;
The central values of q has been reduced from 2 to more realistic values that takes into account episodic sawtooth crashes in this discharges;
The pedestal is moved from the region (0.8:0.9) to (0.9:1);
The densities and temperatures in the plasma core have more realistic values. Near the magnetic axis, the plasma pressure in the new equilibrium is significantly smaller comparing to the pressure in the old equilibrium;
The new equilibria include vacuum field solutions and can be used for the nonlinear extended MHD studies of ELM crashes.
Using the new equilibrium (case s17), a new peeling-ballooning diagram is generated. The diagram is also described and available online. Key features of the PB diagram include:
The diagram indicates the toroidal mode numbers that are close to be modes observed in experiments. The modes identified on the PB diagram are n=5, n=9 and n=11;
Both the peeling and ballooning boundaries were identified;
The experimental pedestal conditions that are expected to correspond to n=5 and n=9 modes are determined;
It is indicated that transition from n=9 to n=5 modes is likely to be associated with very small changes in the pedestal density and temperature, but rather significant changes in the parallel current density;
The pedestal temperatures that are found to be associated with n=5 and n=9 are 800 eV and 775 eV correspondingly. These values are somewhat above the experimental temperatures that are expected to be in the range from 400 eV to 700 eV. The differences between temperature found in the stability analysis and experimental range for temperatures can be explained if the Sauter model, that has been used in this analysis for the bootstap current, over-predicts the values of the bootstrap current. The expected over-predict is about 20%.
The kinetic neoclassical XGC0 code has been used to investigate the pedestal buildup dynamics. For this study, a KSTAR equilibrium with somewhat relaxed pedestal has been used. The results of this study are documented here and here.
For the range of expected temperatures, it is noted that the pedestal buildup dynamics can be very different. The cases with lower plasma collisionality exhibit a faster pedestal buildup. For these case, the pedestal height is increasing and the pedestal width is decreasing faster comparing to the cases with higher plasma collisionality. The cases with lower collisionality are likely to be become unstable sooner for the PB modes.
The kinetic predictions for the bootstrap currents are compared for these case. It is shown that the bootstrap current is significantly larger for the cases with lower plasma collisionality. Similar observations are made for the radial electric field and the poloidal velocity rotation profiles.
The extended MHD simulations of the KSTAR discharge 7328 using the NIMROD and BOUT++ codes are compared here. It has been shown that
The NIMROD and BOUT++ produce comparable growth rates;
The resistivity profiles and a proper account for the diamagnetic effects are important;
The parallel viscosity effects have relatively weak effect on the ELM dynamics at least during a linear stage of a crash.
Possible future studies can include:
Improvements in the equilibrium solve in the vacuum region and further increase in the (R,Z) resolutions;
Verification and validation of the bootstrap current models. It will be interesting to confirm one of the conclusions from the PB stability analysis that the Sauter model over-predicts the bootstrap currents in the KSTAR pedestal. The expected over-predict can be of order of 20%. The XGC0 code or some other new models for the bootstrap current can be compared with Sauter.
The XGC0 simulations with impurities can be performed to compare with the available experimental measurements from KSTAR including rotation profiles etc.
Comparison of NIMROD and BOUT++ results can be continued. The objective of this study can be the development of extended MHD model that includes necessary and essential physics to describe ELM. The importance of various two-fluid and FLR effects are still needs to be confirmed for the KSTAR plasma parameters. It is not completely clear if separate evolution of density will change linear or nonlinear results. Finally, the nonlinear dynamics of ELMs and the propagation of ELM filaments to the plasma wall including the associated heat loads can be investigated. As a near term objective of this NIMROD/BOUT++ study can be a test of hypothesis that the two-fluid effects nearly cancel the resistivity effects, and ideal stability analysis can be used for KSTAR.